
Annual Report
2022

Eurasian Patent Examination
In 2022, the Eurasian Patent Office received 3,731 Eurasian applications for inventions and 233 Eurasian applications for industrial designs.
Statistics of Eurasian Applications
In 2022, the positive trend in the receipt of Eurasian applications continued, and the number of Eurasian applications received by the Eurasian Patent Office increased by 2.5 per cent compared to the number of Eurasian applications received in 2021.
In total, 68,105 Eurasian patent applications were filed from 1996 to 2022, inclusive.
Diagram 1 presents detailed numbers on the Eurasian patent applications filed in the last 5 years.
Total Eurasian patent applications over the last 5 years
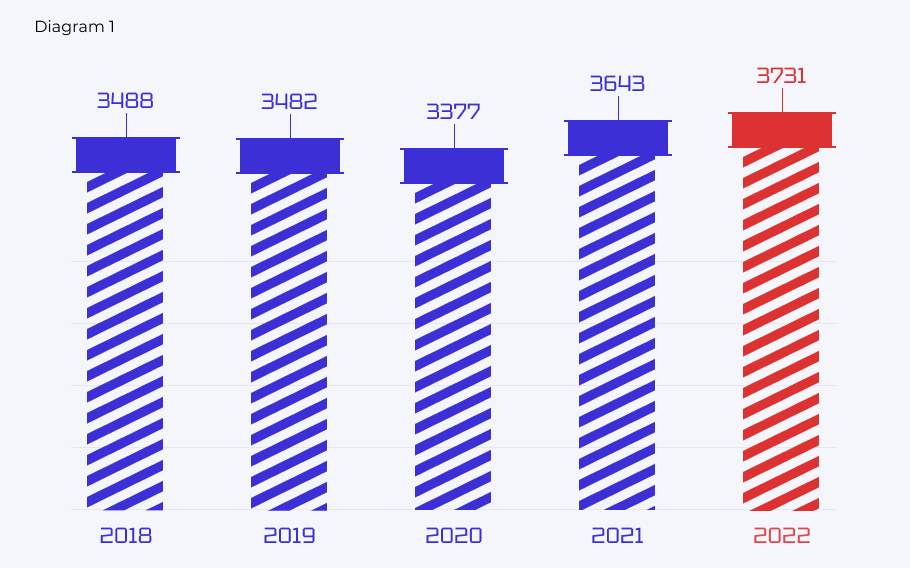
Diagram 2 presents the distribution of Eurasian patent applications by the specifics of their filing procedure.
Eurasian patent applications by specifics of filing procedure
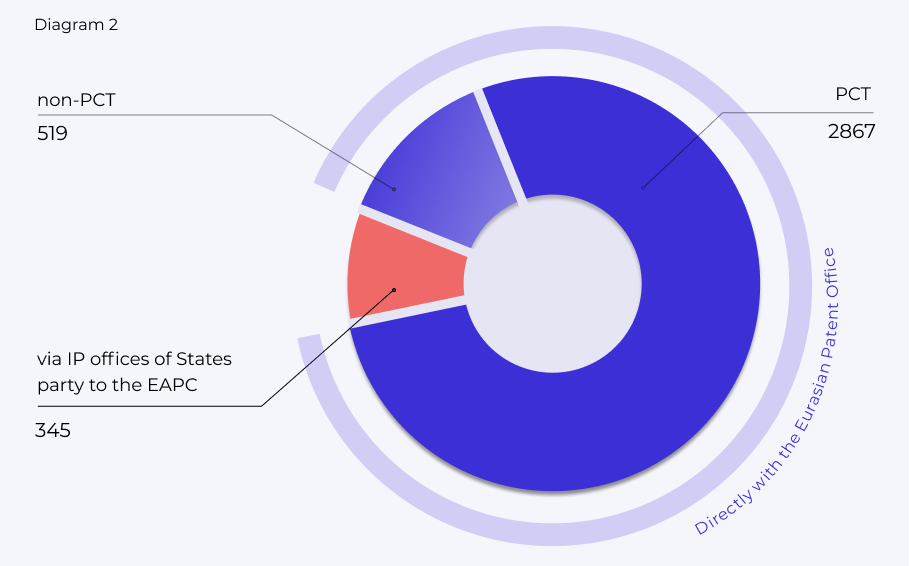
International applications accounted for the bulk of patent applications in 2022, totaling 2,867 Eurasian applications, or 77 per cent of all Eurasian applications filed.
The year 2022 saw 519 Eurasian applications filed directly with the Eurasian Patent Office, or 14 per cent percent of all Eurasian applications filed in the period under review. Notably, 345 Eurasian applications were filed in 2022 via the national IP offices of States party to the EAPC, or 9 per cent of all Eurasian applications filed.
Diagram 3 shows the distribution of Eurasian applications from the countries which had the largest numbers of Eurasian applications in 2022. In total, in 2022, applications were filed by applicants from 72 countries (from 133 countries over the whole history).
Eurasian applications by country of origin showing the largest number of Eurasian applications in 2022

Two-letter codes for the presentation of states are provided in accordance with WIPO Standard ST. 3.
As in the preceding years, the United States of America proved to be the largest geographical source of applications, representing 1,171, or 31.4 per cent of all applications filed with the Eurasian Patent Office.
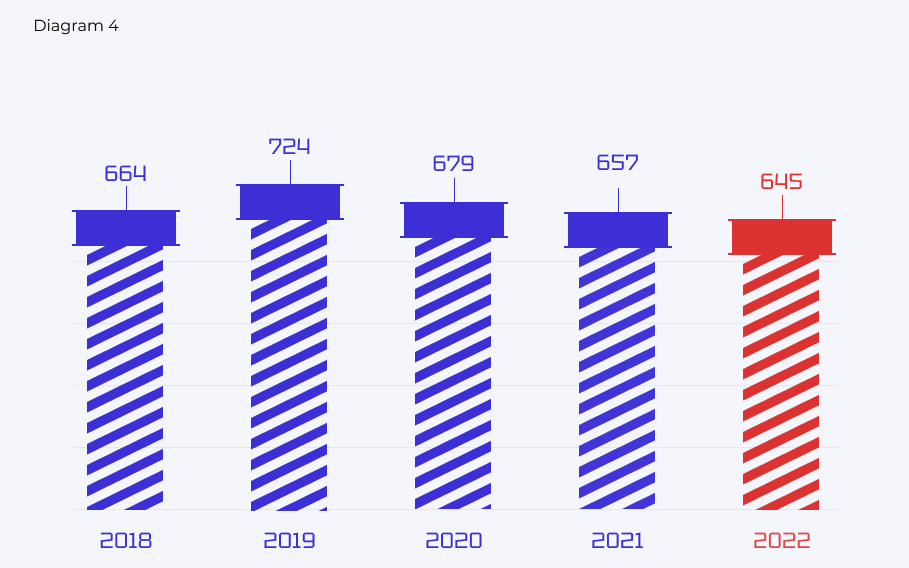
In 2022, applicants from the States party to the EAPC filed 645 Eurasian applications.
The largest number of Eurasian patent applications was from the Russian Federation, with 444 applications, the Republic of Belarus, with 75 applications, the Republic of Kazakhstan, with 69 applications, and the Republic of Azerbaijan, with 45 applications.
Diagram 4 shows the trend in Eurasian patent application filing under the aforementioned procedures for applicants from States party to the EAPC.
Eurasian patent application filings by applicants from States party to the EAPC
In 2022, the most applications were filed for inventions in organic chemistry, pharmaceuticals, and medicines. Table 1 shows the distribution of Eurasian applications filed in 2022 by subject matter.
The year 2022 saw 3,565 Eurasian applications filed electronically, which is 96 per cent of all Eurasian applications received in 2022.
Table 1
Distribution of Eurasian applications filed in 2022 by technical field
|
Total |
|
|
Libraries of chemical compounds |
0.07 per cent |
|
Biochemistry, sugar, skins (C12–C14) |
5.50 per cent |
|
Paper (D21, B31) |
0.42 per cent |
|
Hydraulic and pneumatic mechanisms (F15–F17) |
0.98 per cent |
|
Mining (E21) |
1.63 per cent |
|
Engines and pumps (F01–F04) |
1.17 per cent |
|
Measurements and optics (G01–G03) |
3.13 per cent |
|
Information technologies |
0.13 per cent |
|
Paints and dyes, fuel, animal and vegetable oil (C09–C11) |
1.17 per cent |
|
Medications and pharmaceuticals (A61K) |
24.18 per cent |
|
Medicine and veterinary (A61–A63 except for A61K) |
7.07 per cent |
|
Metallurgy and electrolysis (C21–C23, C25) |
1.66 per cent |
|
Nanotechnology |
0.03 per cent |
|
Inorganic chemistry (C01–C05, C30) |
2.44 per cent |
|
Working and shaping (B21–B30, B32) |
1.60 per cent |
|
Wearing apparel, personal and domestic articles (A41–A47) |
0.55 per cent |
|
Organic chemistry (C07, A01N) |
23.7 per cent |
|
Organic macromolecular compounds (C08) |
1.11 per cent |
|
Weapons and ammunition (F41, F42, C06) |
0.33 per cent |
|
Lighting, heating, and refrigeration (F21–F28) |
1.24 per cent |
|
Printing and decorative arts (B41–B44) |
0.07 per cent |
|
Foodstuffs and tobacco (A21–A24) |
6.12 per cent |
|
Agriculture (A01 except for A01N) |
1.69 per cent |
|
Educational appliances (G09–G12) |
0.26 per cent |
|
Building (E01–E06) |
3.00 per cent |
|
Textiles (D01–D07) |
0.42 per cent |
|
Horology, computing, signaling (G04–G08) |
2.12 per cent |
|
Transporting (B60–B68) |
2.28 per cent |
|
Physical and chemical processes (B01–B09) |
2.93 per cent |
|
Electricity (H01, H02, H05) |
1.60 per cent |
|
Electronic circuitry and electronic communication (H03, H04) |
0.75 per cent |
|
Nuclear physics (G21) |
0.65 per cent |
|
Total |
100.00 per cent |
The average duration of the first office action in 2022 (in month)
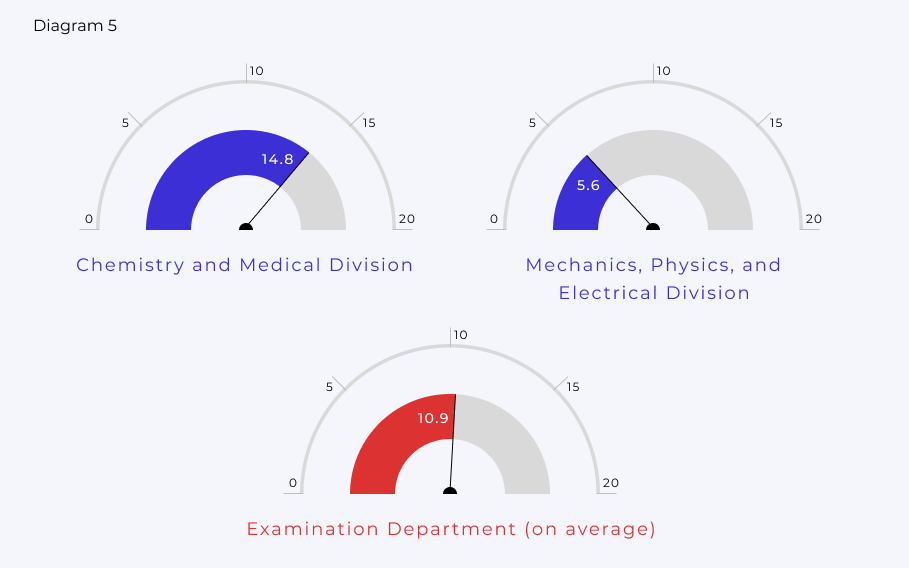
The average duration of application examination as of the end of 2022 (in month)

Eurasian patents for inventions
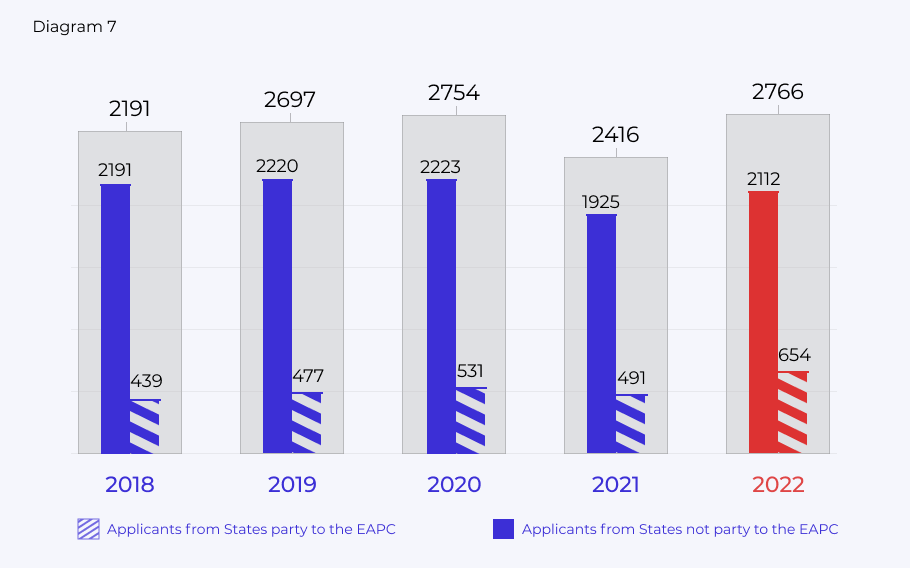
The positive trend in the granting of Eurasian patents was restored in 2022. There were 2,766 patents granted during the reporting period, growth of 14.5 per cent compared to 2021.
The grand total for 1996 through 2022 reached 42,064 grants of Eurasian patents.
Diagram 7 presents detailed numbers on Eurasian patents granted over the past 5 years.
In 2022, representatives of 64 countries became Eurasian patent owners, including residents of 7 States party to the EAPC.
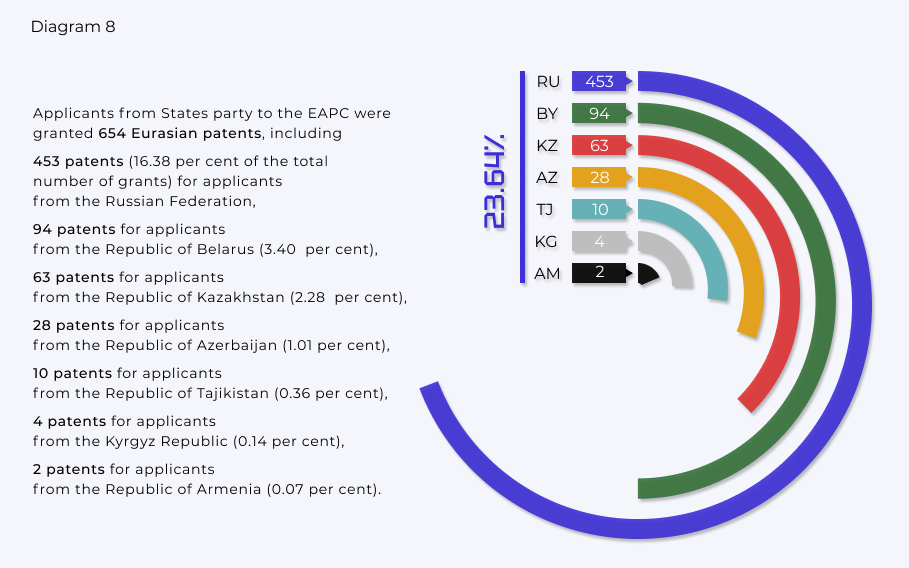
In 2022, the share of patents granted to applicants from the States party to the EAPC was 23.64 per cent of the total number of Eurasian patents granted in 2022.
Two-letter codes for the presentation of states are provided in accordance with WIPO Standard ST. 3.
In the previous year, applicants from States party to the EAPC were granted 491 Eurasian patents, and so, in the reporting year, their percentage grew by 33.20 per cent.
Applicants from States not party to the EAPC were granted 2,112 Eurasian patents in 2022. Their share amounted to 76.36 per cent of the total number of patents granted in 2022.
In 2021, applicants from States not party to the EAPC were granted 1,925 Eurasian patents. The reporting year saw growth of 9.60 per cent.
In 2022, the largest share of Eurasian patents was granted to applicants from the United States of America, with 593 patents, or 21.44 per cent of all patents granted.
Diagram 9 presents the distribution of Eurasian patents granted in 2022 by country of origin, for the countries whose applicants received the largest numbers of Eurasian patents.
Distribution of Eurasian patents by country of origin for countries with the largest numbers of Eurasian patents granted in 2022

Two-letter codes for the presentation of states are provided in accordance with WIPO Standard ST. 3.
The main share of Eurasian patents granted in 2022, as in priors years, constituted international applications entered the regional phase at the Eurasian Patent Office under the PCT procedure: 1994 patents, or 72.10 per cent of the total number of patents granted.
The largest numbers of patents based on international applications were granted to applicants from the United States of America, with 488 patents (24.47 per cent of the total), Germany, with 180 patents (9.03 per cent), Switzerland, with 179 patents (8.98 per cent), the Russian Federation, with 137 patents (6.87 per cent), and Great Britain, with 116 patents (5.82 per cent).
As of the end of the reporting year, there were 18,471 Eurasian patents in force in the territory of the States party to the EAPC and the Republic of Moldova. This indicator increased by 859 patents, or 4.56 per cent, compared to the previous year (17,665 patents).
Number of valid Eurasian patents in the States party to the EAPC and the Republic of Moldova as of the end of 2022
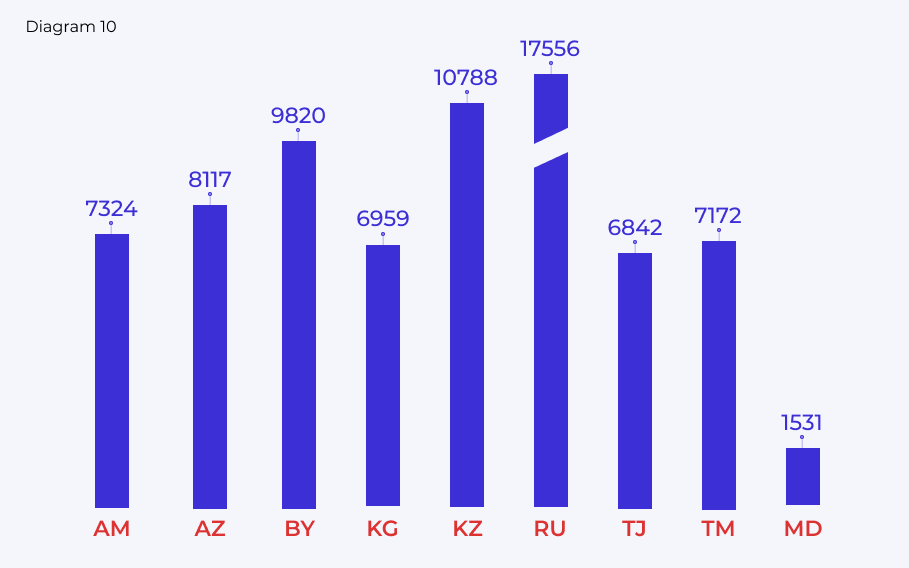
Two-letter codes for the presentation of states are provided in accordance with WIPO Standard ST. 3.
The average number of States party to the EAPC indicated by patent owners in their applications for the maintenance of Eurasian patents in force is 3.6. In 2018–2021, this value was 3.4–3.5.
Table 2 shows the trend in designations of States party to the EAPC and the Republic of Moldova regarding the total number of Eurasian patents for which maintenance fees are paid.
Table 2
Trend in designations of States party to the EAPC and the Republic of Moldova
|
|
Percentage of total number of requests |
||||
|
|
2018 |
2019 |
2020 |
2021 |
2022 |
|
Republic of Armenia |
26.9 |
26.7 |
27.4 |
27.8 |
30.5 |
|
Republic of Azerbaijan |
33.4 |
33.1 |
33.2 |
33.5 |
36.1 |
|
Republic of Belarus |
44.8 |
44.5 |
44.3 |
45.1 |
47.4 |
|
Kyrgyz Republic |
25.6 |
25.2 |
25.1 |
25.7 |
28.3 |
|
Republic of Kazakhstan |
51.3 |
51.0 |
51.6 |
49.7 |
54.8 |
|
Russian Federation |
97.2 |
97.2 |
97.2 |
95.5 |
95.2 |
|
Republic of Tajikistan |
24.9 |
24.6 |
24.6 |
25.1 |
27.6 |
|
Turkmenistan |
27.3 |
27.1 |
27.0 |
27.3 |
29.2 |
|
Republic of Moldova |
18.2 |
14.8 |
12.3 |
10.3 |
8.6 |
As follows from the table above, the indicator for the Russian Federation remains at the level of 2021. The number of designations of the Republic of Moldova has decreased annually since the state’s denunciation of the Eurasian Patent Convention on April 26, 2012. In 2022, the remaining states saw an upward trend in the number of designations.
At the end of the reporting year, 1,105 Eurasian patents lapsed due to the expiration of the twenty-year period set forth in Article 11 of the Eurasian Patent Convention. In 2022, 210 patents expired.
In 2022, 1,838 Eurasian patents prematurely lapsed in full due to failure to pay the maintenance fee within the prescribed term. The number of patents which lapsed for this reason in 2021 amounted to 2,105. Thus, in the reporting year, this indicator decreased by 12.68 per cent.
In 2022, the validity of 94 Eurasian patents which had previously lapsed in the territory of a State party to the EAPC was renewed at the request of the patent owners.
According to the national legislation of the States party to the EAPC and the Republic of Moldova which provides for the supplementary legal protection of assets whose use requires a special permit, 48 requests for the extension of Eurasian patent terms were satisfied in respect of 40 patents.
Table 3
Trends in Eurasian patent term extension in States party to the EAPC over the past 5 years
|
|
2018 |
2019 |
2020 |
2021 |
2022 |
|
Number of patents |
38 |
35 |
29 |
74 |
40 |
|
by state: |
|||||
|
Republic of Armenia |
3 |
5 |
4 |
3 |
2 |
|
Republic of Azerbaijan |
1 |
- |
- |
2 |
4 |
|
Republic of Belarus |
3 |
6 |
4 |
18 |
7 |
|
Republic of Kazakhstan |
14 |
9 |
7 |
16 |
15 |
|
Russian Federation |
13 |
13 |
17 |
32 |
19 |
|
Republic of Tajikistan |
- |
- |
- |
1 |
- |
|
Republic of Moldova |
2 |
2 |
- |
1 |
1 |
In 2022, the national IP offices contributed information to the Eurasian Patent Office on registered license agreements based on Eurasian patents, namely:
- the patent office of the Republic of Belarus provided information on 2 registered license agreements based on 2 Eurasian patents
- the patent office of the Kyrgyz Republic provided information on 3 license agreements based on 5 Eurasian patents
- the patent office of the Republic of Kazakhstan provided information on 16 license agreements based on 30 Eurasian patents
- the patent office of the Russian Federation provided information on 33 license agreements based on 51 Eurasian patents
Patent Prosecution Highway (PPH) Programs
The patent offices of Japan, China, the Republic of Korea, and Finland, as well as the European Patent Office (EPO), are partner offices of the Eurasian Patent Office for Patent Prosecution Highway (PPH) programs. The composition of the Eurasian Patent Office’s partners for PPH programs did not change in the reporting year.
At the beginning of 2022, the Eurasian Patent Office and the China National Intellectual Property Administration (CNIPA) agreed to renew the current PPH program for another year with the prospect of discussing the expansion of the program in the future, taking into account the Eurasian Patent Office’s appointment as an International Searching Authority (ISA) and International Preliminary Examining Authority (IPEA) under the Patent Cooperation Treaty (PCT).
At the end of 2021, the pilot phase of the PPH program with the Korean Intellectual Property Office of the Republic of Korea (KIPO) was completed. In accordance with the memorandum signed between the Eurasian Patent Office and the KIPO on the PPH program, the program has operated on an indefinite basis since January 1, 2022.
In total, in 2022, the Eurasian Patent Office received 29 requests for the accelerated examination of PPH programs, the largest number of which were submitted on the basis of conclusions and decisions prepared by the EPO.