Eurasian Patent Examination
The Eurasian Patent office received 3,302 applications for Eurasian patent protection in 2017, down 2 per cent from 2016.
Eurasian Application Statistics
Overall, the Eurasian Patent Office had 50,384 Eurasian applications since the year of the Eurasian Patent Organization’s establishment in 1996 through 2017.
See Diagram 1 for detailed numbers of the Eurasian applications filed in the last 6 years.
Total Eurasian applications over the last 6 years
Total applications
Diagram 2 distributes the Eurasian applications subject to the specificities of the filing procedure.
Eurasian applications subject to the specificities of the filing procedure
Total applications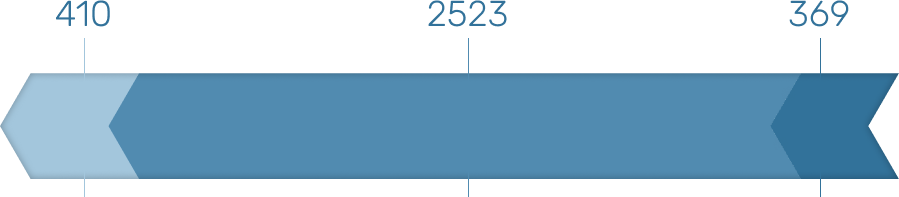
International applications accounted for the bulk of Eurasian applications in 2017 totalling 2,523 applications, or 76.4 per cent of all the applications filed.
The year 2017 saw 369 applications filed directly with the Eurasian Patent Office, or 11.2 per cent of overall Eurasian application filings made in the period under review. Notably, 410 applications were filed in 2017 via national IP Offices of the Contracting States, or 12.4 per cent of the total Eurasian applications filed.
Diagram 3 cascades the Eurasian applications by country of origin showing the largest number of Eurasian applications filed in 2017.
Eurasian applications cascaded by country of origin showing the largest number of Eurasian applications made in 2017
Total applications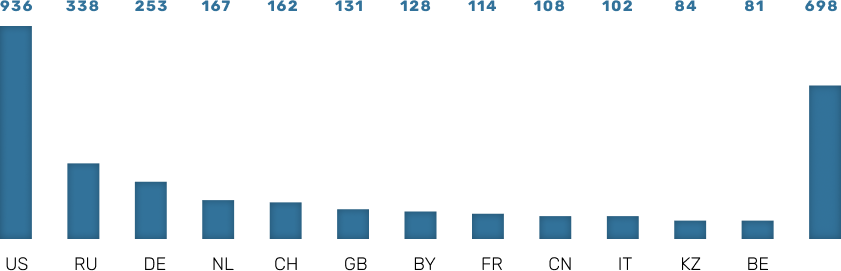 Other
Other
As in the preceding years, the United States of America proved the largest geographical source of Eurasian applications, 936, or 28.3 per cent of all the applications lodged with the Eurasian Patent Office.
Innovators from states party to the Eurasian Patent Convention were responsible for 594 applications in 2017.
The largest number of Eurasian applications came from the Russian Federation, 338, the Republic of Belarus, 128, the Republic of Kazakhstan, 84, and the Republic of Azerbaijan, 33.
Diagram 4 details the Eurasian applications filing dynamics under the aforementioned procedures for the applicants from states party to the Eurasian Patent Convention.
Eurasian applications by innovators from states party to the Eurasian Patent Convention
Total applications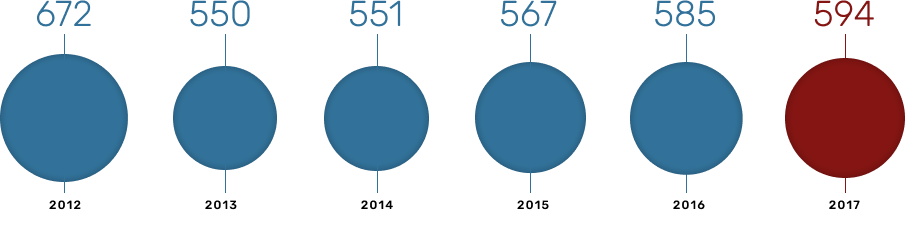
The distribution pattern for Eurasian applications by industry did not change significantly in the year under review. Similar to the previous reporting periods, the most applications were filed for inventions in organic chemistry, pharmaceuticals and medicines. Table 1 distributes by subject matter the Eurasian applications filed in 2017.
The year 2017 saw 2,683 applications filed electronically, which is 81 per cent of all the Eurasian applications for 2017.
Distribution of Eurasian applications filed in 2017 by technical field
| Technical field | Total |
|---|---|
| Biochemistry, sugar, skins (C12-C14) | 4,88% |
| Paper (D21, B31) | 0,17% |
| Hydraulic and pneumatic mechanisms (F15-F17) | 1,36% |
| Mining (E21) | 2,76% |
| Engines and pumps (F01-F04) | 1,20% |
| Measurements and optics (G01-G03) | 4,38% |
| Paints and dyes, fuel, animal and vegetable oil (C09-C11) | 3,05% |
| Medications and pharmaceuticals (A61K) | 18,26% |
| Medicine and veterinary (A61-A63 except for A61K) | 4,98% |
| Metallurgy and electrolysis (C21-C23, C25) | 2,56% |
| Inorganic chemistry (C01-C05, C30) | 3,32% |
| Working and shaping (B21-B30, B32) | 2,52% |
| Wearing Apparel, personal and domestic articles (A41-A47) | 0,93% |
| Organic chemistry (C07, A01N) | 23,04% |
| Organic macromolecular compounds (C08) | 1,73% |
| Weapons and ammunition (F41, F42, C06) | 0,30% |
| Lighting, heating, refrigeration (F21-F28) | 1,86% |
| Printing and decorative arts (B41-B44) | 0,46% |
| Foodstuffs and tobacco (A21-A24) | 2,82% |
| Agriculture (A01 except for A01N) | 1,39% |
| Educational appliances (G09-G12) | 0,53% |
| Building (E01-E06) | 2,56% |
| Textiles (D01-D07) | 0,40% |
| Horology, computing , signalling (G04-G08) | 1,86% |
| Transporting (B60-B68) | 3,92% |
| Physical and chemical processes (B01-B09) | 3,88% |
| Electrical engineering (H01, H02, H05) | 2,92% |
| Electronics and communications (H03, H04) | 1,63% |
| Nuclear physics (G21) | 0,23% |
| Total | 100,00% |
Eurasian patent grants
The Eurasian Patent Register received 3,179 new entries in the reporting period. The years 1996 through 2017 saw 29,270 Eurasian patents registered.
In 2017 alone, 3,282 Eurasian patents were granted, which constitutes 6.53 per cent growth from the previous year. The grand total for 1996 through 2017 reached 28,801 Eurasian patent grants.
Applicants from EAPC Member States and the Republic of Moldova were granted 616 Eurasian patents in 2017, marking 18.77 per cent of all the patent grants that year. By contrast, the year 2016 saw 481 Eurasian patents granted to innovators from EAPC Member States and the Republic of Moldova, or 15.61 per cent of all the patent grants in that reported period.
Applicants from states not party to the EAPC had 2,666 Eurasian patent grants in 2017. The share of patents granted to innovators from non-EAPC Member States totalled 81.23 per cent of all the grants for 2017.
See Table 2 for the Eurasian patent grants of 2017 distributed by country of patent owners' place of residence.
Eurasian patent grants for 2017 distributed by country of patent owners' place of residence
| Country code | Number of patents granted | Same in per cent of total number |
|---|---|---|
| States party to the EAPC and the Republic of Moldova | ||
| AM | 3 | 0,09 |
| AZ | 34 | 1,04 |
| BY | 184 | 5,61 |
| KG | 4 | 0,12 |
| KZ | 52 | 1,58 |
| MD | 1 | 0,03 |
| RU | 332 | 10,12 |
| TJ | 4 | 0,12 |
| TM | 2 | 0,06 |
| Total for states party to the EAPC and the Republic of Moldova | 616 | 18,77 |
| Non-EAPC Member States | ||
| AE | 1 | 0,03 |
| AR | 3 | 0,09 |
| AT | 45 | 1,37 |
| AU | 37 | 1,13 |
| BE | 68 | 2,07 |
| BG | 2 | 0,06 |
| BH | 1 | 0,03 |
| BM | 1 | 0,03 |
| BR | 1 | 0,03 |
| BS | 1 | 0,03 |
| CA | 33 | 1,01 |
| CH | 182 | 5,55 |
| CL | 5 | 0,15 |
| CN | 66 | 2,01 |
| CU | 2 | 0,06 |
| CY | 7 | 0,21 |
| CZ | 16 | 0,49 |
| DE | 311 | 9,48 |
| DK | 81 | 2,47 |
| EE | 4 | 0,12 |
| ES | 20 | 0,61 |
| FI | 85 | 2,59 |
| FR | 223 | 6,79 |
| GB | 118 | 3,60 |
| GR | 1 | 0,03 |
| HU | 14 | 0,43 |
| IE | 25 | 0,76 |
| IL | 20 | 0,61 |
| IN | 18 | 0,55 |
| IT | 120 | 3,66 |
| JP | 114 | 3,47 |
| KR | 10 | 0,30 |
| KY | 5 | 0,15 |
| LI | 3 | 0,09 |
| LT | 1 | 0,03 |
| LU | 16 | 0,49 |
| LV | 3 | 0,09 |
| MT | 1 | 0,03 |
| MX | 4 | 0,12 |
| MY | 1 | 0,03 |
| NG | 1 | 0,03 |
| NL | 253 | 7,71 |
| NO | 46 | 1,40 |
| NZ | 6 | 0,18 |
| PH | 1 | 0,03 |
| PL | 11 | 0,34 |
| PT | 3 | 0,09 |
| RO | 3 | 0,09 |
| SA | 9 | 0,27 |
| SE | 38 | 1,16 |
| SG | 5 | 0,15 |
| SI | 6 | 0,18 |
| SK | 2 | 0,06 |
| TR | 18 | 0,55 |
| UA | 10 | 0,30 |
| US | 574 | 17,49 |
| UZ | 1 | 0,03 |
| VG | 5 | 0,15 |
| ZA | 5 | 0,15 |
| Total for states not party to the EAPC | 2666 | 81,23 |
| Grand Total | 3282 | 100 |
Representatives of 68 countries became Eurasian patent owners in 2017, including residents of 8 countries party to the EAPC and the Republic of Moldova.
The largest number of Eurasian patent grants went in 2017 to applicants from the United States of America, 574 patents (17.49 per cent); Russia, 332 patents (10.12 per cent); Germany, 311 patents (9.48 per cent); Netherlands, 253 patents (7.71 per cent); France, 223 patents (6.79 per cent); the Republic of Belarus, 184 patents (5.61 per cent); Switzerland, 182 patents (5.55 per cent); Great Britain, 118 patents (3.60 per cent); Japan, 114 patents (3.47 per cent); Italy, 120 patents (3.66 per cent).
The reporting period saw 2,596 Eurasian patents granted on the basis of international applications that had entered the regional phase of the PCT procedure.
Table 3 distributes the Eurasian patent grants based on applications filed with the Eurasian Patent Office under the PCT in 2017.
2017 Eurasian patent grants based on international applications and distributed by owners' country of residence
| Country code | Number of patent grants | Same in per cent of total number |
|---|---|---|
| BY | 2 | 0,08 |
| MD | 1 | 0,04 |
| RU | 116 | 4,47 |
| Total for states party to the EAPC and the Republic of Moldova | 119 | 4,58 |
| AE | 1 | 0,04 |
| AT | 44 | 1,69 |
| AU | 31 | 1,19 |
| BE | 67 | 2,58 |
| BG | 2 | 0,08 |
| BH | 1 | 0,04 |
| BM | 1 | 0,04 |
| BR | 1 | 0,04 |
| CA | 27 | 1,04 |
| CH | 174 | 6,70 |
| CL | 5 | 0,19 |
| CN | 61 | 2,35 |
| CU | 2 | 0,08 |
| CY | 3 | 0,12 |
| CZ | 15 | 0,58 |
| DE | 283 | 10,90 |
| DK | 78 | 3,00 |
| EE | 4 | 0,15 |
| ES | 19 | 0,73 |
| FI | 80 | 3,08 |
| FR | 211 | 8,13 |
| GB | 116 | 4,47 |
| GR | 1 | 0,04 |
| HU | 13 | 0,50 |
| IE | 21 | 0,81 |
| IL | 18 | 0,69 |
| IN | 18 | 0,69 |
| IT | 111 | 4,28 |
| JP | 107 | 4,12 |
| KR | 10 | 0,39 |
| KY | 5 | 0,19 |
| LI | 3 | 0,12 |
| LT | 1 | 0,04 |
| LU | 16 | 0,62 |
| LV | 2 | 0,08 |
| MT | 1 | 0,04 |
| MX | 3 | 0,12 |
| MY | 1 | 0,04 |
| NG | 1 | 0,04 |
| NL | 249 | 9,59 |
| NO | 37 | 1,43 |
| NZ | 6 | 0,23 |
| PH | 1 | 0,04 |
| PL | 10 | 0,39 |
| PT | 3 | 0,12 |
| RO | 3 | 0,12 |
| SA | 9 | 0,35 |
| SE | 36 | 1,39 |
| SG | 5 | 0,19 |
| SI | 6 | 0,23 |
| SK | 2 | 0,08 |
| TR | 16 | 0,62 |
| UA | 6 | 0,23 |
| US | 523 | 20,15 |
| UZ | 1 | 0,04 |
| VG | 2 | 0,08 |
| ZA | 4 | 0,15 |
| Total for states not party to the EAPC | 2477 | 95,42 |
| GRAND TOTAL | 2596 | 100 |
Applicants from two EAPC Member States and the Republic of Moldova were granted 119 Eurasian patents in 2017, or 4.58 per cent of the total Eurasian patent grants based on international applications. The previous reporting year saw 3.96 per cent of the total Eurasian patent grants based on international applications. The largest amount of such patents, 116 (or 4.47 per cent), went to Russian Federation applicants.
At the same time, innovators from 57 states not party to the EAPC were granted 2,477 Eurasian patents, or 95.42 per cent of all the Eurasian patent grants based on international applications. The largest number of patents went to the holders in the United States of America, 523 Eurasian patents (20.15 per cent); Germany, 283 Eurasian patents (10.90 per cent); Netherlands, 249 Eurasian patents (9.59 per cent); France, 211 Eurasian patents (8.13 per cent); Switzerland, 174 Eurasian patents (6.70 per cent).
As at 31 December 2017, a total of 252 Eurasian patents had been terminated in the territory of EAPC Members States and the Republic of Moldova due to the expiry of their twenty-year term under Article 11, Eurasian Patent Convention.
As at the same date, the Eurasian patents in force in the territory of the EAPC Members States and the Republic of Moldova totalled 15,444 patents.
The first annual fees were paid for maintaining 2,786 Eurasian patents in force in 2017.
See Table 4 for details of the first annual fees paid for the Eurasian patents in 2017.
Details of the first annual fees paid in 2017 for maintaining Eurasian patents in force
| First patent owner’s country-of-origin code | Number of patents for which the annual maintenance fee was paid | Same in per cent of total number of patents | Number of designations of EAPC Member States and Republic of Moldova | Same in per cent of all designations | Average number of designations per patent | Designations of EAPC Member States and Republic of Moldova | ||||||||
|---|---|---|---|---|---|---|---|---|---|---|---|---|---|---|
| AM | AZ | BY | KG | KZ | MD | RU | TJ | TM | ||||||
| AZ | 14 | 0,5 | 23 | 0,22 | 1,64 | 0 | 9 | 0 | 0 | 0 | 0 | 14 | 0 | 0 |
| BY | 82 | 2,94 | 222 | 2,08 | 2,71 | 8 | 15 | 64 | 11 | 34 | 0 | 79 | 5 | 6 |
| KG | 1 | 0,04 | 2 | 0,02 | 2 | 0 | 0 | 0 | 1 | 0 | 0 | 1 | 0 | 0 |
| KZ | 34 | 1,22 | 127 | 1,19 | 3,74 | 7 | 9 | 18 | 15 | 29 | 2 | 33 | 7 | 7 |
| MD | 2 | 0,07 | 11 | 0,1 | 5,5 | 1 | 1 | 2 | 1 | 2 | 0 | 2 | 1 | 1 |
| RU | 217 | 7,79 | 994 | 9,32 | 4,58 | 100 | 118 | 166 | 85 | 171 | 11 | 183 | 85 | 75 |
| TJ | 2 | 0,07 | 3 | 0,03 | 1,5 | 0 | 0 | 0 | 0 | 0 | 0 | 2 | 1 | 0 |
| TM | 1 | 0,04 | 1 | 0,01 | 1 | 0 | 0 | 0 | 0 | 0 | 0 | 0 | 0 | 1 |
| Total | 353 | 12,67 | 1 383 | 12,97 | 3,92 | 116 | 152 | 250 | 113 | 236 | 13 | 314 | 99 | 90 |
| AE | 1 | 0,04 | 9 | 0,08 | 9 | 1 | 1 | 1 | 1 | 1 | 1 | 1 | 1 | 1 |
| AR | 1 | 0,04 | 8 | 0,08 | 8 | 1 | 1 | 1 | 1 | 1 | 0 | 1 | 1 | 1 |
| AT | 55 | 1,97 | 190 | 1,78 | 3,45 | 13 | 20 | 27 | 12 | 32 | 6 | 54 | 12 | 14 |
| AU | 34 | 1,22 | 140 | 1,31 | 4,12 | 10 | 10 | 18 | 10 | 27 | 5 | 34 | 15 | 11 |
| BE | 52 | 1,87 | 142 | 1,33 | 2,73 | 7 | 12 | 24 | 7 | 19 | 3 | 52 | 7 | 11 |
| BG | 1 | 0,04 | 1 | 0,01 | 1 | 0 | 0 | 0 | 0 | 0 | 0 | 1 | 0 | 0 |
| BH | 1 | 0,04 | 2 | 0,02 | 2 | 1 | 0 | 0 | 0 | 0 | 0 | 1 | 0 | 0 |
| BS | 4 | 0,14 | 31 | 0,29 | 7,75 | 3 | 4 | 4 | 3 | 4 | 3 | 4 | 2 | 4 |
| CA | 33 | 1,18 | 188 | 1,76 | 5,7 | 20 | 22 | 22 | 19 | 25 | 10 | 33 | 19 | 18 |
| CH | 163 | 5,85 | 546 | 5,12 | 3,35 | 44 | 42 | 69 | 48 | 76 | 27 | 163 | 38 | 39 |
| CL | 5 | 0,18 | 7 | 0,07 | 1,4 | 0 | 0 | 0 | 0 | 2 | 0 | 5 | 0 | 0 |
| CN | 62 | 2,23 | 277 | 2,6 | 4,47 | 17 | 26 | 44 | 25 | 51 | 8 | 62 | 18 | 26 |
| CU | 2 | 0,07 | 2 | 0,02 | 1 | 0 | 0 | 0 | 0 | 0 | 0 | 2 | 0 | 0 |
| CY | 3 | 0,11 | 11 | 0,1 | 3,67 | 1 | 1 | 1 | 1 | 1 | 1 | 3 | 1 | 1 |
| CZ | 14 | 0,5 | 58 | 0,54 | 4,14 | 5 | 5 | 10 | 3 | 13 | 1 | 14 | 3 | 4 |
| DE | 300 | 10,77 | 987 | 9,26 | 3,29 | 72 | 77 | 166 | 57 | 163 | 30 | 298 | 58 | 66 |
| DK | 72 | 2,58 | 168 | 1,58 | 2,33 | 8 | 17 | 20 | 8 | 20 | 4 | 72 | 8 | 11 |
| EE | 4 | 0,14 | 10 | 0,09 | 2,5 | 0 | 0 | 4 | 0 | 2 | 0 | 4 | 0 | 0 |
| ES | 17 | 0,61 | 67 | 0,63 | 3,94 | 6 | 7 | 6 | 6 | 10 | 3 | 17 | 6 | 6 |
| FI | 63 | 2,26 | 153 | 1,44 | 2,43 | 4 | 10 | 13 | 9 | 41 | 2 | 63 | 5 | 6 |
| FR | 208 | 7,47 | 610 | 5,72 | 2,93 | 50 | 60 | 55 | 39 | 80 | 27 | 207 | 40 | 52 |
| GB | 102 | 3,66 | 394 | 3,7 | 3,86 | 38 | 47 | 40 | 33 | 55 | 12 | 101 | 33 | 35 |
| HK | 2 | 0,07 | 18 | 0,17 | 9 | 2 | 2 | 2 | 2 | 2 | 2 | 2 | 2 | 2 |
| HR | 2 | 0,07 | 10 | 0,09 | 5 | 2 | 2 | 1 | 1 | 1 | 0 | 2 | 1 | 0 |
| HU | 14 | 0,5 | 93 | 0,87 | 6,64 | 10 | 11 | 12 | 10 | 11 | 7 | 14 | 9 | 9 |
| IE | 25 | 0,9 | 107 | 1 | 4,28 | 10 | 10 | 10 | 10 | 18 | 4 | 25 | 10 | 10 |
| IL | 17 | 0,61 | 76 | 0,71 | 4,47 | 8 | 9 | 9 | 8 | 9 | 6 | 16 | 5 | 6 |
| IN | 20 | 0,72 | 120 | 1,13 | 6 | 12 | 13 | 13 | 12 | 16 | 10 | 20 | 12 | 12 |
| IS | 1 | 0,04 | 1 | 0,01 | 1 | 0 | 0 | 0 | 0 | 0 | 0 | 1 | 0 | 0 |
| IT | 104 | 3,73 | 484 | 4,54 | 4,65 | 45 | 58 | 63 | 42 | 70 | 21 | 103 | 38 | 44 |
| JP | 101 | 3,63 | 294 | 2,76 | 2,91 | 17 | 27 | 26 | 21 | 48 | 5 | 99 | 19 | 32 |
| KR | 11 | 0,39 | 58 | 0,54 | 5,27 | 5 | 6 | 7 | 6 | 8 | 3 | 11 | 6 | 6 |
| KY | 4 | 0,14 | 7 | 0,07 | 1,75 | 0 | 1 | 0 | 0 | 1 | 0 | 4 | 0 | 1 |
| LT | 1 | 0,04 | 9 | 0,08 | 9 | 1 | 1 | 1 | 1 | 1 | 1 | 1 | 1 | 1 |
| LU | 17 | 0,61 | 89 | 0,83 | 5,24 | 8 | 9 | 10 | 9 | 14 | 5 | 17 | 8 | 9 |
| LV | 5 | 0,18 | 37 | 0,35 | 7,4 | 4 | 5 | 5 | 4 | 5 | 1 | 5 | 4 | 4 |
| MT | 2 | 0,07 | 9 | 0,08 | 4,5 | 1 | 1 | 1 | 1 | 1 | 0 | 2 | 1 | 1 |
| MX | 4 | 0,14 | 16 | 0,15 | 4 | 1 | 2 | 1 | 1 | 4 | 1 | 4 | 1 | 1 |
| MY | 1 | 0,04 | 3 | 0,03 | 3 | 0 | 0 | 0 | 0 | 1 | 0 | 1 | 1 | 0 |
| NL | 216 | 7,75 | 533 | 5 | 2,47 | 26 | 48 | 66 | 21 | 75 | 14 | 216 | 22 | 45 |
| NO | 61 | 2,19 | 192 | 1,8 | 3,15 | 12 | 29 | 16 | 10 | 33 | 6 | 61 | 11 | 14 |
| NZ | 6 | 0,22 | 37 | 0,35 | 6,17 | 4 | 4 | 4 | 4 | 6 | 1 | 6 | 4 | 4 |
| PE | 2 | 0,07 | 10 | 0,09 | 5 | 1 | 1 | 1 | 1 | 1 | 1 | 2 | 1 | 1 |
| PL | 7 | 0,25 | 41 | 0,38 | 5,86 | 5 | 5 | 7 | 3 | 6 | 1 | 7 | 4 | 3 |
| PT | 1 | 0,04 | 1 | 0,01 | 1 | 0 | 0 | 0 | 0 | 0 | 0 | 1 | 0 | 0 |
| RS | 1 | 0,04 | 1 | 0,01 | 1 | 0 | 0 | 0 | 0 | 0 | 0 | 1 | 0 | 0 |
| SA | 7 | 0,25 | 19 | 0,18 | 2,71 | 0 | 3 | 0 | 3 | 3 | 0 | 7 | 3 | 0 |
| SE | 37 | 1,33 | 125 | 1,17 | 3,38 | 11 | 11 | 18 | 9 | 18 | 3 | 37 | 9 | 9 |
| SG | 5 | 0,18 | 36 | 0,34 | 7,2 | 4 | 4 | 4 | 4 | 4 | 3 | 5 | 4 | 4 |
| SI | 11 | 0,39 | 27 | 0,25 | 2,45 | 2 | 2 | 4 | 1 | 4 | 1 | 11 | 1 | 1 |
| SK | 3 | 0,11 | 21 | 0,2 | 7 | 2 | 3 | 3 | 2 | 3 | 1 | 3 | 2 | 2 |
| TR | 19 | 0,68 | 101 | 0,95 | 5,32 | 10 | 12 | 11 | 10 | 11 | 8 | 19 | 10 | 10 |
| UA | 7 | 0,25 | 47 | 0,44 | 6,71 | 5 | 5 | 7 | 5 | 7 | 1 | 7 | 5 | 5 |
| US | 513 | 18,41 | 2 612 | 24,5 | 5,09 | 269 | 287 | 284 | 261 | 315 | 155 | 508 | 259 | 274 |
| VG | 8 | 0,29 | 41 | 0,38 | 5,13 | 2 | 7 | 5 | 2 | 6 | 2 | 8 | 2 | 7 |
| ZA | 1 | 0,04 | 3 | 0,03 | 3 | 0 | 0 | 1 | 0 | 1 | 0 | 1 | 0 | 0 |
| Total | 2 433 | 87,33 | 9 279 | 87,03 | 3,81 | 780 | 940 | 1117 | 746 | 1326 | 406 | 2419 | 722 | 823 |
| Grand Total | 2 786 | 100 | 10 662 | 100 | 3,83 | 896 | 1092 | 1367 | 859 | 1562 | 419 | 2733 | 821 | 913 |
Table 4 shows 3.83 as the average number of designations of EAPC Member States and the Republic of Moldova at the point of the first payment of annual fees for maintaining the Eurasian patent in force.
Following is the recurrence of designations of the EAPC Member States and the Republic of Moldova in relation to the total patents for which the annual maintenance fee was paid for the first time in 2017:
Russia, 98.10 per cent; Kazakhstan, 56.07 per cent; Belarus, 49.07 per cent; Azerbaijan, 39.20 per cent; Turkmenistan, 32.77 per cent; Armenia, 32.16 per cent; Kyrgyzstan, 30.83 per cent; Tajikistan, 29.47 per cent and Moldova, 15.04 per cent.
Subsequent annual fees were paid in 2017 for maintaining in force 9,341 Eurasian patents.
Table 5 lists data on Eurasian patents for which subsequent annual fees were paid in 2017.
Details of Eurasian patents for which subsequent maintenance fees were paid in 2017
| First patent owner's country-of-origin code | Number of patents for which the first annual maintenance fee was paid | Same in per cent of the total number of patents | Number of designations of the EAPC Member States and Republic of Moldova | Same in per cent of the total number of designations | Average number of designations per patent | Designations of the EAPC Member States and the Republic of Moldova | ||||||||
|---|---|---|---|---|---|---|---|---|---|---|---|---|---|---|
| AM | AZ | BY | KG | KZ | MD | RU | TJ | TM | ||||||
| AM | 5 | 0,05 | 9 | 0,03 | 1,8 | 0 | 0 | 1 | 1 | 1 | 0 | 5 | 1 | 0 |
| AZ | 14 | 0,15 | 24 | 0,07 | 1,71 | 0 | 8 | 1 | 0 | 2 | 0 | 13 | 0 | 0 |
| BY | 172 | 1,84 | 494 | 1,52 | 2,87 | 18 | 28 | 160 | 16 | 72 | 8 | 167 | 14 | 11 |
| KG | 5 | 0,05 | 6 | 0,02 | 1,2 | 0 | 0 | 0 | 0 | 1 | 0 | 5 | 0 | 0 |
| KZ | 63 | 0,67 | 184 | 0,57 | 2,92 | 7 | 12 | 20 | 16 | 52 | 5 | 56 | 6 | 10 |
| MD | 6 | 0,06 | 16 | 0,05 | 2,67 | 1 | 2 | 2 | 1 | 2 | 0 | 6 | 1 | 1 |
| RU | 711 | 7,61 | 2 457 | 7,55 | 3,46 | 185 | 240 | 475 | 143 | 462 | 96 | 591 | 133 | 132 |
| TJ | 1 | 0,01 | 9 | 0,03 | 9 | 1 | 1 | 1 | 1 | 1 | 1 | 1 | 1 | 1 |
| TM | 1 | 0,01 | 1 | 0 | 1 | 0 | 0 | 0 | 0 | 0 | 0 | 1 | 0 | 0 |
| Total | 978 | 10,5 | 3 200 | 9,84 | 3,27 | 212 | 291 | 660 | 178 | 593 | 110 | 845 | 156 | 155 |
| AE | 6 | 0,06 | 30 | 0,09 | 5 | 2 | 4 | 3 | 2 | 5 | 2 | 5 | 3 | 4 |
| AN | 2 | 0,02 | 10 | 0,03 | 5 | 1 | 1 | 1 | 1 | 1 | 1 | 2 | 1 | 1 |
| AR | 3 | 0,03 | 21 | 0,06 | 7 | 3 | 3 | 3 | 2 | 2 | 1 | 3 | 2 | 2 |
| AT | 152 | 1,63 | 469 | 1,44 | 3,09 | 25 | 38 | 71 | 26 | 80 | 27 | 150 | 27 | 25 |
| AU | 108 | 1,16 | 463 | 1,42 | 4,29 | 36 | 40 | 47 | 40 | 78 | 33 | 105 | 44 | 40 |
| BB | 1 | 0,01 | 9 | 0,03 | 9 | 1 | 1 | 1 | 1 | 1 | 1 | 1 | 1 | 1 |
| BE | 401 | 4,29 | 1 442 | 4,43 | 3,6 | 118 | 125 | 160 | 117 | 170 | 116 | 400 | 116 | 120 |
| BG | 7 | 0,07 | 34 | 0,1 | 4,86 | 4 | 4 | 4 | 3 | 3 | 3 | 7 | 3 | 3 |
| BM | 2 | 0,02 | 4 | 0,01 | 2 | 1 | 0 | 0 | 0 | 1 | 0 | 2 | 0 | 0 |
| BR | 8 | 0,09 | 13 | 0,04 | 1,63 | 0 | 1 | 1 | 0 | 2 | 0 | 8 | 0 | 1 |
| BS | 6 | 0,06 | 36 | 0,11 | 6 | 3 | 5 | 5 | 3 | 5 | 3 | 6 | 1 | 5 |
| BZ | 1 | 0,01 | 8 | 0,02 | 8 | 1 | 1 | 1 | 1 | 1 | 0 | 1 | 1 | 1 |
| CA | 88 | 0,94 | 319 | 0,98 | 3,63 | 24 | 27 | 36 | 23 | 55 | 21 | 83 | 23 | 27 |
| CH | 590 | 6,32 | 2 089 | 6,42 | 3,54 | 151 | 157 | 247 | 167 | 308 | 154 | 584 | 154 | 167 |
| CL | 3 | 0,03 | 27 | 0,08 | 9 | 3 | 3 | 3 | 3 | 3 | 3 | 3 | 3 | 3 |
| CN | 116 | 1,24 | 445 | 1,37 | 3,84 | 33 | 37 | 62 | 34 | 67 | 28 | 113 | 33 | 38 |
| CU | 12 | 0,13 | 38 | 0,12 | 3,17 | 3 | 3 | 5 | 3 | 3 | 3 | 12 | 3 | 3 |
| CY | 21 | 0,22 | 112 | 0,34 | 5,33 | 11 | 13 | 16 | 8 | 17 | 8 | 21 | 8 | 10 |
| CZ | 41 | 0,44 | 92 | 0,28 | 2,24 | 5 | 5 | 15 | 3 | 17 | 3 | 41 | 1 | 2 |
| DE | 1 119 | 12 | 2 861 | 8,79 | 2,56 | 130 | 162 | 500 | 127 | 410 | 151 | 1110 | 128 | 143 |
| DK | 234 | 2,51 | 728 | 2,24 | 3,11 | 49 | 65 | 101 | 47 | 79 | 47 | 234 | 49 | 57 |
| EE | 15 | 0,16 | 38 | 0,12 | 2,53 | 1 | 2 | 9 | 1 | 7 | 1 | 15 | 1 | 1 |
| EG | 1 | 0,01 | 3 | 0,01 | 3 | 0 | 1 | 0 | 0 | 1 | 0 | 1 | 0 | 0 |
| ES | 59 | 0,63 | 218 | 0,67 | 3,69 | 18 | 20 | 27 | 16 | 26 | 19 | 58 | 16 | 18 |
| FI | 400 | 4,28 | 714 | 2,19 | 1,79 | 10 | 23 | 67 | 8 | 179 | 9 | 396 | 11 | 11 |
| FR | 590 | 6,32 | 2 092 | 6,43 | 3,55 | 170 | 207 | 221 | 155 | 256 | 165 | 582 | 156 | 180 |
| GB | 385 | 4,12 | 1 428 | 4,39 | 3,71 | 109 | 159 | 149 | 103 | 204 | 103 | 379 | 106 | 116 |
| GR | 8 | 0,09 | 22 | 0,07 | 2,75 | 3 | 3 | 2 | 1 | 2 | 1 | 8 | 1 | 1 |
| HK | 3 | 0,03 | 3 | 0,01 | 1 | 0 | 0 | 0 | 0 | 0 | 0 | 3 | 0 | 0 |
| HR | 4 | 0,04 | 10 | 0,03 | 2,5 | 0 | 1 | 2 | 0 | 2 | 0 | 4 | 0 | 1 |
| HU | 61 | 0,65 | 390 | 1,2 | 6,39 | 40 | 43 | 44 | 39 | 46 | 39 | 61 | 39 | 39 |
| IE | 71 | 0,76 | 311 | 0,96 | 4,38 | 27 | 27 | 35 | 27 | 43 | 26 | 71 | 27 | 28 |
| IL | 53 | 0,57 | 243 | 0,75 | 4,58 | 23 | 26 | 29 | 22 | 30 | 20 | 52 | 21 | 20 |
| IN | 68 | 0,73 | 405 | 1,24 | 5,96 | 40 | 43 | 44 | 44 | 47 | 38 | 66 | 42 | 41 |
| IS | 4 | 0,04 | 7 | 0,02 | 1,75 | 0 | 0 | 2 | 0 | 1 | 0 | 4 | 0 | 0 |
| IT | 338 | 3,62 | 1 713 | 5,26 | 5,07 | 143 | 171 | 217 | 144 | 236 | 162 | 333 | 143 | 164 |
| JP | 367 | 3,93 | 980 | 3,01 | 2,67 | 58 | 90 | 75 | 63 | 140 | 56 | 366 | 54 | 78 |
| KN | 1 | 0,01 | 1 | 0 | 1 | 0 | 0 | 0 | 0 | 0 | 0 | 1 | 0 | 0 |
| KR | 32 | 0,34 | 170 | 0,52 | 5,31 | 16 | 17 | 18 | 18 | 28 | 13 | 31 | 14 | 15 |
| KW | 1 | 0,01 | 9 | 0,03 | 9 | 1 | 1 | 1 | 1 | 1 | 1 | 1 | 1 | 1 |
| KY | 2 | 0,02 | 10 | 0,03 | 5 | 1 | 1 | 1 | 1 | 1 | 1 | 2 | 1 | 1 |
| LI | 3 | 0,03 | 12 | 0,04 | 4 | 1 | 1 | 2 | 1 | 1 | 1 | 3 | 1 | 1 |
| LT | 2 | 0,02 | 4 | 0,01 | 2 | 0 | 0 | 1 | 0 | 1 | 0 | 2 | 0 | 0 |
| LU | 71 | 0,76 | 391 | 1,2 | 5,51 | 41 | 37 | 41 | 36 | 59 | 36 | 71 | 34 | 36 |
| LV | 18 | 0,19 | 117 | 0,36 | 6,5 | 12 | 13 | 15 | 11 | 14 | 12 | 18 | 11 | 11 |
| MA | 4 | 0,04 | 12 | 0,04 | 3 | 1 | 1 | 1 | 1 | 1 | 1 | 4 | 1 | 1 |
| MC | 1 | 0,01 | 1 | 0 | 1 | 0 | 0 | 0 | 0 | 0 | 0 | 1 | 0 | 0 |
| MT | 2 | 0,02 | 3 | 0,01 | 1,5 | 0 | 0 | 0 | 0 | 1 | 0 | 2 | 0 | 0 |
| MU | 1 | 0,01 | 9 | 0,03 | 9 | 1 | 1 | 1 | 1 | 1 | 1 | 1 | 1 | 1 |
| MX | 5 | 0,05 | 38 | 0,12 | 7,6 | 4 | 4 | 4 | 4 | 5 | 4 | 5 | 4 | 4 |
| MY | 4 | 0,04 | 4 | 0,01 | 1 | 0 | 0 | 0 | 0 | 0 | 0 | 4 | 0 | 0 |
| NL | 584 | 6,25 | 1 248 | 3,84 | 2,14 | 37 | 126 | 132 | 37 | 183 | 38 | 576 | 35 | 84 |
| NO | 200 | 2,14 | 778 | 2,39 | 3,89 | 51 | 132 | 57 | 49 | 137 | 42 | 200 | 52 | 58 |
| NZ | 19 | 0,2 | 57 | 0,18 | 3 | 3 | 5 | 4 | 3 | 12 | 3 | 19 | 3 | 5 |
| PE | 1 | 0,01 | 9 | 0,03 | 9 | 1 | 1 | 1 | 1 | 1 | 1 | 1 | 1 | 1 |
| PH | 1 | 0,01 | 9 | 0,03 | 9 | 1 | 1 | 1 | 1 | 1 | 1 | 1 | 1 | 1 |
| PL | 25 | 0,27 | 132 | 0,41 | 5,28 | 12 | 14 | 20 | 10 | 20 | 10 | 24 | 11 | 11 |
| PR | 1 | 0,01 | 9 | 0,03 | 9 | 1 | 1 | 1 | 1 | 1 | 1 | 1 | 1 | 1 |
| PT | 4 | 0,04 | 20 | 0,06 | 5 | 2 | 2 | 2 | 2 | 2 | 2 | 4 | 2 | 2 |
| RO | 3 | 0,03 | 8 | 0,02 | 2,67 | 1 | 0 | 1 | 0 | 2 | 0 | 3 | 0 | 1 |
| RS | 5 | 0,05 | 8 | 0,02 | 1,6 | 0 | 1 | 1 | 1 | 0 | 0 | 5 | 0 | 0 |
| SA | 46 | 0,49 | 103 | 0,32 | 2,24 | 1 | 13 | 1 | 13 | 13 | 1 | 46 | 13 | 2 |
| SC | 2 | 0,02 | 3 | 0,01 | 1,5 | 0 | 0 | 0 | 0 | 1 | 0 | 2 | 0 | 0 |
| SE | 154 | 1,65 | 454 | 1,4 | 2,95 | 27 | 31 | 70 | 25 | 68 | 26 | 153 | 27 | 27 |
| SG | 8 | 0,09 | 30 | 0,09 | 3,75 | 2 | 3 | 5 | 2 | 3 | 2 | 8 | 2 | 3 |
| SI | 33 | 0,35 | 75 | 0,23 | 2,27 | 5 | 4 | 7 | 3 | 11 | 4 | 33 | 4 | 4 |
| SK | 2 | 0,02 | 18 | 0,06 | 9 | 2 | 2 | 2 | 2 | 2 | 2 | 2 | 2 | 2 |
| TH | 1 | 0,01 | 3 | 0,01 | 3 | 0 | 1 | 0 | 0 | 1 | 0 | 1 | 0 | 0 |
| TR | 31 | 0,33 | 110 | 0,34 | 3,55 | 9 | 13 | 9 | 9 | 12 | 8 | 31 | 9 | 10 |
| TW | 13 | 0,14 | 101 | 0,31 | 7,77 | 11 | 11 | 11 | 11 | 11 | 11 | 13 | 11 | 11 |
| UA | 37 | 0,4 | 177 | 0,54 | 4,78 | 17 | 19 | 32 | 13 | 28 | 13 | 31 | 12 | 12 |
| US | 1 668 | 17,9 | 7 254 | 22,3 | 4,35 | 651 | 767 | 758 | 615 | 917 | 623 | 1637 | 623 | 663 |
| UZ | 2 | 0,02 | 3 | 0,01 | 1,5 | 0 | 0 | 0 | 0 | 1 | 0 | 2 | 0 | 0 |
| VG | 8 | 0,09 | 41 | 0,13 | 5,13 | 3 | 5 | 5 | 3 | 7 | 3 | 8 | 3 | 4 |
| YU | 3 | 0,03 | 4 | 0,01 | 1,33 | 0 | 0 | 1 | 0 | 0 | 1 | 2 | 0 | 0 |
| ZA | 17 | 0,18 | 74 | 0,23 | 4,35 | 7 | 7 | 6 | 7 | 11 | 6 | 17 | 7 | 6 |
| Total | 8 363 | 89,53 | 29336 | 90,16 | 3,51 | 2168 | 2746 | 3417 | 2116 | 4086 | 2112 | 8256 | 2105 | 2330 |
| Grand Total | 9 341 | 100,00 | 32 536 | 100,00 | 3,48 | 2380 | 3037 | 4077 | 2294 | 4679 | 2222 | 9101 | 2261 | 2485 |
Table 5 shows 3.48 as the average number of designations of the EAPC Member States and the Republic of Moldova for the payment of subsequent annual fees for maintaining the Eurasian patents in force. See below the recurrence of designations of the states party to the EAPC and the Republic of Moldova in relation to the total patents for which the annual maintenance fee was paid in 2017:
| Russia – 97,43% | Azerbaijan – 32,51% | Kyrgyzstan – 24,56% |
| Kazakhstan – 50,09% | Turkmenistan – 26,60% | Tajikistan – 24,21% |
| Belarus – 43,65% | Armenia – 25,48 % | Moldova – 23,79% |
The year 2017 saw 123 Eurasian patents restored after termination for failure of the annual fee payment to keep the patents in force, which constitutes 38.21 per cent growth from 2016.
As requested by relevant patent holders and in conformity with national law of the EAPC Member States and the Republic of Moldova that provides for addition legal protection for products that require special permission for application, the validity of 68 Eurasian patents was extended in the territory of such countries as the Republic of Armenia (3 patents), the Republic of Azerbaijan (4 patents), the Republic of Belarus (6 patents), the Republic of Kazakhstan (30 patents), the Russian Federation (21 patents) and the Republic of Moldova (4 patents).
The national patent offices of the Republic of Armenia, the Republic of Belarus, the Republic of Kazakhstan and the Russian Federation contributed information to the Eurasian Patent Office on registered licence contracts based on Eurasian patents in 2017. Relevant information about 28 licence contracts based on 26 Eurasian patents was published in the EAPO Gazette.