Eurasian Patent Examination
In 2018 the Eurasian Patent Office received 3,488 Eurasian applications for the grant of Eurasian patents for inventions, up 5.6 per cent from 2017.
Eurasian Application Statistics
Overall, the Eurasian Patent Office has received 53,872 Eurasian applications since the year of the Eurasian Patent Organization’s establishment in 1996 through 2018.
See Diagram 1 for detailed numbers of the Eurasian applications filed in the last 6 years.
Total Eurasian applications over the last 6 years
Total applications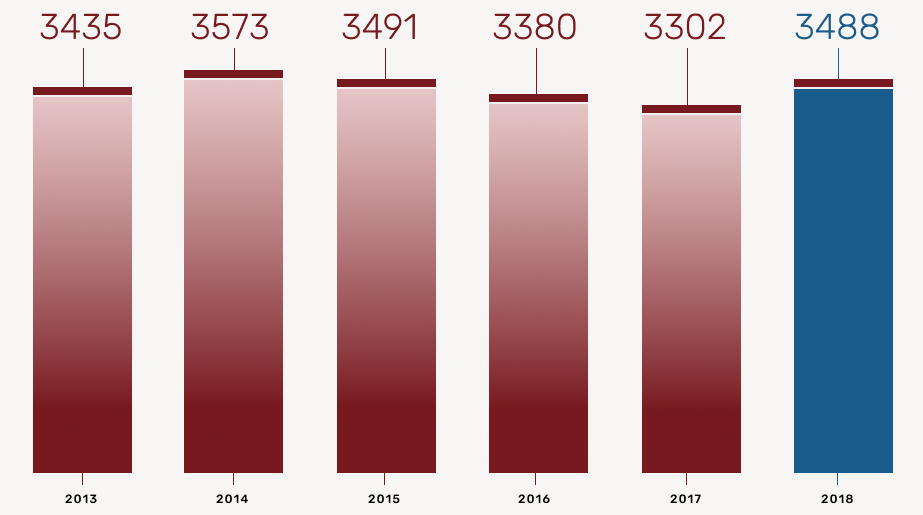
Diagram 2 distributes the Eurasian applications subject to the specificities of the filing procedure.
Eurasian applications subject to the specificities of the filing procedure
Total applications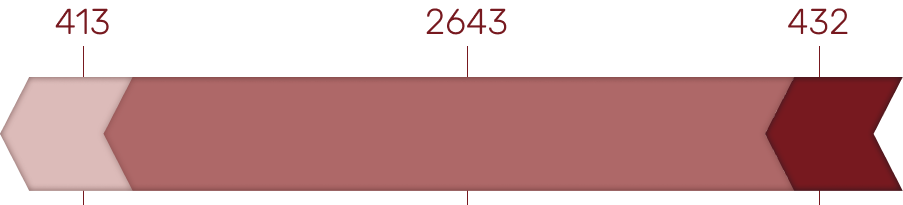
International applications accounted for the bulk of Eurasian applications in 2018 totalling 2,643 applications, or 75,8% per cent of all the applications filed.
The year 2018 saw 432 applications filed directly with the Eurasian Patent Office, which accounts for 12,4% per cent of overall Eurasian application filings during the year. 413 applications were filed in 2018 via national IP Offices of the Contracting States, or 11,8% per cent of the total amount of Eurasian applications filed.
Diagram 3 cascades the Eurasian applications by country of origin showing the largest number of Eurasian applications filed in 2018.
Eurasian applications cascaded by country of origin showing the largest number of Eurasian applications made in 2018
Total applications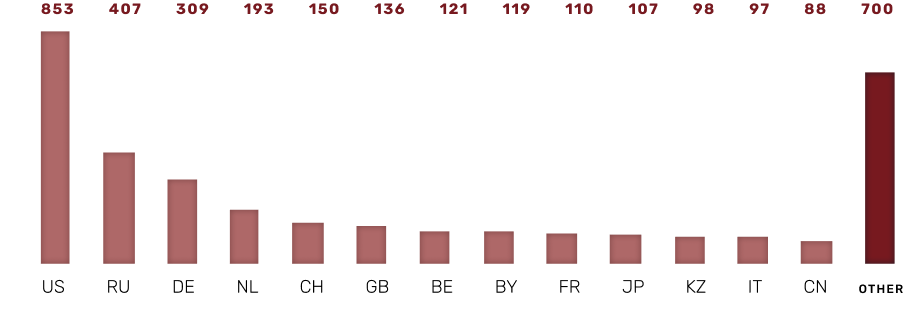
As in the preceding years, the United States of America proved the largest geographical source of Eurasian applications, 853 or 24,5% per cent of all the applications filed with the Eurasian Patent Office.
Applicants from the States party to the Eurasian Patent Convention filed 663 applications in 2018.
The largest number of Eurasian applications came from the Russian Federation, 407, the Republic of Belarus, 119, the Republic of Kazakhstan, 98, and the Republic of Azerbaijan,29.
Diagram 4 details the Eurasian applications filing dynamics under the aforementioned procedures for applicants from the States party to the Eurasian Patent Convention.
Eurasian applications by innovators from states party to the Eurasian Patent Convention
Total applications
The distribution pattern for Eurasian applications by industry did not change significantly in 2018. Similar to the previous years, the bulk of applications were filed for inventions in the fields of organic chemistry, pharmaceuticals and medicines. Table 1 distributes the Eurasian applications filed in 2018 by subject matter.
The year 2018 saw 2,841 applications filed electronically, which makes 81% per cent of all the Eurasian applications filed in 2018.
Distribution of Eurasian applications filed in 2018 by technical field
| Classification | Percentage of total number of applications filed |
|---|---|
| Biochemistry, sugar, skins (C12-C14) | 4,60 |
| Paper (D21, B31) | 0,16 |
| Hydraulic and pneumatic mechanisms | 1,09 |
| Mining (E21) | 2,38 |
| Engines and pumps (F01-F04) | 1,48 |
| Measurements and optics (G01-G03) | 3,18 |
| Paints and dyes, fuel, animal and vegetable oil (C09-C11) | 2,67 |
| Medications and pharmaceuticals (A61K) | 19,38 |
| Medicine and veterinary (A61-A63 except for A61K) | 6,04 |
| Metallurgy and electrolysis (C21-C23, C25) | 2,19 |
| Inorganic chemistry (C01-C05, C30) | 3,21 |
| Working and shaping (B21-B30, B32) | 2,22 |
| Wearing apparel, personal and domestic articles (A41-A47) | 1,22 |
| Organic chemistry (C07, A01N) | 23,34 |
| Organic macromolecular compounds (C08) | 1,86 |
| Weapons and ammunition (F41, F42, C06) | 0,29 |
| Lighting, heating and refrigeration (F21-F28) | 2,06 |
| Printing and decorative arts (B41-B44) | 0,29 |
| Foodstuffs and tobacco (A21-A24) | 2,44 |
| Agriculture (A01 except for A01N) | 1,58 |
| Educational appliances (G09-G12) | 0,61 |
| Building (E01-E06) | 3,74 |
| Textiles (D01-D07) | 0,48 |
| Horology, computing, signalling (G04-G08) | 2,57 |
| Transporting (B60-B68) | 2,89 |
| Physical and chemical processes (B01-B09) | 3,92 |
| Electrical engineering (H01, H02, H05) | 2,76 |
| Electronics and communications (H03, H04) | 0,90 |
| Nuclear physics (G21) | 0,45 |
| Total | 100,00% |
Eurasian patent grants
In 2018 the Eurasian Patent Register received 2,576 new entries. Altogether 31,846 Eurasian patents were registered during the period 1996 through 2018.
In the year under review 2,630 Eurasian patents were granted. The grand total for 1996 through 2018 reached 31,431 Eurasian patent grants.
Applicants from EAPC Contracting States and the Republic of Moldova were granted 439 Eurasian patents in 2018, marking 16.69 per cent of all the patent grants during the year.
Applicants from states not party to the EAPC had 2,191 Eurasian patent grants in 2018. The share of patents granted to applicants from non-EAPC Contracting States totalled 83.31 per cent of all the grants for 2018.
See Table 2 for the Eurasian patent grants of 2018 distributed by country of patent owners' place of residence.
Eurasian patent grants for 2018 distributed by country of patent owners' place of residence
| Country code | Number of patents granted | Same in per cent of total number |
|---|---|---|
| EAPC Contracting States and the Republic of Moldova | ||
| AM | 2 | 0,08 |
| AZ | 28 | 1,06 |
| BY | 109 | 4,14 |
| KG | 4 | 0,15 |
| KZ | 41 | 1,56 |
| MD | 2 | 0,08 |
| RU | 249 | 9,47 |
| TJ | 4 | 0,15 |
| Total for the EAPC Contracting States and the Republic of Moldova | 439 | 16,69 |
| Non-EAPC Member States | ||
| AE | 3 | 0,11 |
| AR | 1 | 0,04 |
| AT | 38 | 1,44 |
| AU | 25 | 0,95 |
| BE | 63 | 2,40 |
| BG | 5 | 0,19 |
| BM | 2 | 0,08 |
| BR | 1 | 0,04 |
| CA | 32 | 1,22 |
| CH | 146 | 5,55 |
| CN | 63 | 2,40 |
| CU | 1 | 0,04 |
| CY | 1 | 0,04 |
| CZ | 20 | 0,76 |
| DE | 226 | 8,59 |
| DK | 56 | 2,13 |
| EE | 2 | 0,08 |
| ES | 15 | 0,57 |
| FI | 80 | 3,04 |
| FR | 163 | 6,20 |
| GB | 79 | 3,00 |
| GE | 1 | 0,04 |
| GR | 3 | 0,11 |
| HK | 2 | 0,08 |
| HR | 1 | 0,04 |
| HU | 16 | 0,61 |
| IE | 15 | 0,57 |
| IL | 21 | 0,80 |
| IN | 23 | 0,87 |
| IT | 92 | 3,50 |
| JO | 2 | 0,08 |
| JP | 89 | 3,38 |
| KR | 18 | 0,68 |
| KY | 2 | 0,08 |
| LT | 2 | 0,08 |
| LU | 18 | 0,68 |
| LV | 2 | 0,08 |
| MT | 2 | 0,08 |
| MX | 1 | 0,04 |
| NL | 152 | 5,78 |
| NO | 43 | 1,63 |
| NZ | 12 | 0,46 |
| PL | 15 | 0,57 |
| RO | 2 | 0,08 |
| RS | 1 | 0,04 |
| SA | 18 | 0,68 |
| SC | 1 | 0,04 |
| SE | 32 | 1,22 |
| SG | 1 | 0,04 |
| SI | 6 | 0,23 |
| SK | 1 | 0,04 |
| SN | 1 | 0,04 |
| TR | 15 | 0,57 |
| TW | 1 | 0,04 |
| UA | 7 | 0,27 |
| US | 543 | 20,65 |
| UZ | 1 | 0,04 |
| VG | 1 | 0,04 |
| ZA | 6 | 0,23 |
| Total for the non-EAPC Member States | 2191 | 83,31 |
| Grand Total | 2630 | 100 |
Representatives of 67 countries became Eurasian patent owners in 2018, including residents of 7 States party to the EAPC and the Republic of Moldova.
The largest number of Eurasian patent grants went, in 2018, to applicants from the United States of America, 543 patents (20.65 per cent); Russia, 249 patents (9.74 per cent); Germany, 226 patents (8.59 per cent); France, 163 patents (6.20 per cent); Netherlands, 152 patents (5.78 per cent); Switzerland, 146 patents (5.55 per cent); the Republic of Belarus, 109 patents (4.14 per cent); Italy, 92 patents (3.50 per cent); Japan, 89 patents (3.38 per cent); Finland, 80 patents (3.04 per cent).
The reporting period saw 2,115 Eurasian patents, or 80.42 per cent of the total number of Eurasian patent grants in 2018, granted on the basis of international applications that had entered the regional phase of the PCT procedure.
Table 3 distributes the Eurasian patent grants based on applications filed with the Eurasian Patent Office under the PCT procedure in 2018.
2018 Eurasian patent grants based on international applications and distributed by owners' country of residence
| Country code | Number of patents granted | Same in per cent of total number |
|---|---|---|
| BY | 4 | 0,19 |
| MD | 1 | 0,05 |
| RU | 93 | 4,40 |
| Total for the EAPC Contracting States and the Republic of Moldova | 98 | 4,64 |
| AE | 3 | 0,14 |
| AT | 38 | 1,80 |
| AU | 23 | 1,09 |
| BE | 60 | 2,84 |
| BG | 5 | 0,24 |
| BM | 1 | 0,05 |
| BR | 1 | 0,05 |
| CA | 29 | 1,37 |
| CH | 131 | 6,19 |
| CN | 59 | 2,79 |
| CU | 1 | 0,05 |
| CZ | 19 | 0,90 |
| DE | 209 | 9,88 |
| DK | 53 | 2,51 |
| EE | 1 | 0,05 |
| ES | 15 | 0,71 |
| FI | 76 | 3,59 |
| FR | 150 | 7,09 |
| GB | 72 | 3,40 |
| GE | 1 | 0,05 |
| GR | 3 | 0,14 |
| HK | 2 | 0,09 |
| HR | 1 | 0,05 |
| HU | 16 | 0,76 |
| IE | 13 | 0,61 |
| IL | 19 | 0,90 |
| IN | 22 | 1,04 |
| IT | 87 | 4,11 |
| JO | 2 | 0,09 |
| JP | 83 | 3,92 |
| KR | 14 | 0,66 |
| KY | 2 | 0,09 |
| LT | 2 | 0,09 |
| LU | 17 | 0,80 |
| LV | 2 | 0,09 |
| MT | 2 | 0,09 |
| MX | 1 | 0,05 |
| NL | 140 | 6,62 |
| NO | 39 | 1,84 |
| NZ | 12 | 0,57 |
| PL | 14 | 0,66 |
| RO | 2 | 0,09 |
| RS | 1 | 0,05 |
| SA | 18 | 0,85 |
| SC | 1 | 0,05 |
| SE | 31 | 1,47 |
| SG | 1 | 0,05 |
| SI | 6 | 0,28 |
| SK | 1 | 0,05 |
| SN | 1 | 0,05 |
| TR | 14 | 0,66 |
| TW | 1 | 0,05 |
| UA | 3 | 0,14 |
| US | 490 | 23,17 |
| UZ | 1 | 0,05 |
| ZA | 6 | 0,28 |
| Total for the non-EAPC Member States | 2017 | 95,36 |
| Grand Total | 2115 | 100 |
Applicants from two EAPC Contracting States and the Republic of Moldova were granted 98 Eurasian patents in 2018, or 4.64 per cent of the total Eurasian patent grants based on international applications. The previous reporting year saw 4.58 per cent of the total Eurasian patent grants based on international applications. The largest amount of such patents, 93 (or 4.40 per cent), went to Russian Federation applicants.
At the same time, innovators from 56 states not party to the EAPC were granted 2,017 Eurasian patents, or 95.36 per cent of all the Eurasian patent grants based on international applications. The largest number of patents went to the holders from the United States of America, 490 Eurasian patents (23.17 per cent); Germany, 209 Eurasian patents (9.88 per cent); France, 150 Eurasian patents (7.09 per cent); Netherlands, 140 Eurasian patents (6.62 per cent) and Switzerland, 131 Eurasian patents (6.19 per cent).
As of 31 December 2018, a total of 381 Eurasian patents had been terminated in the territory of EAPC Contracting States and the Republic of Moldova due to the expiry of their twenty-year term under Article 11 of the Eurasian Patent Convention.
As of the same date, the Eurasian patents in force in the territory of the EAPC Contracting States and the Republic of Moldova totalled 15,851 patents.
The first annual fees were paid for maintaining 2,461 Eurasian patents in force in 2018.
See Table 4 for details of the first annual fees paid for the Eurasian patents in 2018.
Details of the first annual fees paid in 2018 for maintaining Eurasian patents in force
| First patent owner’s country-of-origin code | Number of patents for which the annual maintenance fee was paid | Same in per cent of total number of patents | Number of designations of EAPC Contracting States and Republic of Moldova | Same in per cent of all designations | Average number of designations per patent | Designations of EAPC Contracting States and Republic of Moldova | ||||||||
|---|---|---|---|---|---|---|---|---|---|---|---|---|---|---|
| AM | AZ | BY | KG | KZ | MD | RU | TJ | TM | ||||||
| AM | 2 | 0,08 | 9 | 0,10 | 4,50 | 1 | 1 | 2 | 1 | 1 | 0 | 2 | 1 | 0 |
| AZ | 15 | 0,61 | 42 | 0,46 | 2,80 | 3 | 7 | 4 | 3 | 4 | 0 | 15 | 3 | 3 |
| BY | 74 | 3,01 | 176 | 1,92 | 2,38 | 6 | 8 | 67 | 4 | 21 | 0 | 64 | 3 | 3 |
| KG | 1 | 0,04 | 4 | 0,04 | 4,00 | 0 | 0 | 0 | 1 | 1 | 0 | 1 | 1 | 0 |
| KZ | 18 | 0,73 | 77 | 0,84 | 4,28 | 5 | 6 | 13 | 10 | 17 | 0 | 17 | 4 | 5 |
| RU | 227 | 9,22 | 960 | 10,46 | 4,23 | 95 | 107 | 176 | 81 | 166 | 6 | 176 | 76 | 77 |
| TJ | 2 | 0,08 | 4 | 0,04 | 2,00 | 0 | 0 | 0 | 0 | 0 | 0 | 2 | 2 | 0 |
| TM | 1 | 0,04 | 2 | 0,02 | 2,00 | 0 | 0 | 1 | 0 | 0 | 0 | 1 | 0 | 0 |
| Total | 340 | 13,82 | 1 274 | 13,88 | 3,75 | 110 | 129 | 263 | 100 | 210 | 6 | 278 | 90 | 88 |
| AE | 1 | 0,04 | 9 | 0,10 | 9,00 | 1 | 1 | 1 | 1 | 1 | 1 | 1 | 1 | 1 |
| AR | 3 | 0,12 | 24 | 0,26 | 8,00 | 3 | 3 | 3 | 3 | 3 | 0 | 3 | 3 | 3 |
| AT | 39 | 1,58 | 118 | 1,29 | 3,03 | 7 | 9 | 17 | 7 | 23 | 2 | 39 | 7 | 7 |
| AU | 18 | 0,73 | 73 | 0,80 | 4,06 | 6 | 6 | 10 | 6 | 14 | 1 | 18 | 7 | 5 |
| BE | 66 | 2,68 | 199 | 2,17 | 3,02 | 15 | 17 | 26 | 15 | 25 | 3 | 66 | 15 | 17 |
| BG | 3 | 0,12 | 24 | 0,26 | 8,00 | 3 | 3 | 3 | 3 | 3 | 0 | 3 | 3 | 3 |
| BM | 2 | 0,08 | 10 | 0,11 | 5,00 | 1 | 1 | 1 | 1 | 1 | 1 | 2 | 1 | 1 |
| BR | 1 | 0,04 | 2 | 0,02 | 2,00 | 1 | 0 | 0 | 0 | 0 | 0 | 1 | 0 | 0 |
| CA | 32 | 1,30 | 130 | 1,42 | 4,06 | 12 | 12 | 14 | 12 | 19 | 2 | 32 | 15 | 12 |
| CH | 144 | 5,85 | 411 | 4,48 | 2,85 | 30 | 28 | 50 | 31 | 67 | 5 | 144 | 27 | 29 |
| CL | 1 | 0,04 | 9 | 0,10 | 9,00 | 1 | 1 | 1 | 1 | 1 | 1 | 1 | 1 | 1 |
| CN | 47 | 1,91 | 235 | 2,56 | 5,00 | 21 | 27 | 27 | 25 | 33 | 4 | 47 | 28 | 23 |
| CU | 2 | 0,08 | 3 | 0,03 | 1,50 | 0 | 0 | 1 | 0 | 0 | 0 | 2 | 0 | 0 |
| CY | 6 | 0,24 | 29 | 0,32 | 4,83 | 5 | 5 | 6 | 1 | 5 | 0 | 5 | 1 | 1 |
| CZ | 17 | 0,69 | 61 | 0,66 | 3,59 | 4 | 4 | 12 | 4 | 11 | 1 | 17 | 4 | 4 |
| DE | 241 | 9,79 | 727 | 7,92 | 3,02 | 53 | 47 | 125 | 42 | 121 | 14 | 240 | 38 | 47 |
| DK | 60 | 2,44 | 159 | 1,73 | 2,65 | 10 | 15 | 21 | 7 | 24 | 2 | 60 | 7 | 13 |
| EE | 1 | 0,04 | 1 | 0,01 | 1,00 | 0 | 0 | 0 | 0 | 0 | 0 | 1 | 0 | 0 |
| ES | 21 | 0,85 | 103 | 1,12 | 4,90 | 11 | 11 | 14 | 10 | 15 | 1 | 21 | 10 | 10 |
| FI | 83 | 3,37 | 195 | 2,13 | 2,35 | 9 | 8 | 23 | 7 | 51 | 2 | 83 | 6 | 6 |
| FR | 175 | 7,11 | 425 | 4,63 | 2,43 | 27 | 39 | 42 | 26 | 55 | 5 | 175 | 25 | 31 |
| GB | 85 | 3,45 | 366 | 3,99 | 4,31 | 34 | 50 | 37 | 32 | 55 | 9 | 83 | 31 | 35 |
| GE | 1 | 0,04 | 8 | 0,09 | 8,00 | 1 | 1 | 1 | 1 | 1 | 0 | 1 | 1 | 1 |
| HK | 1 | 0,04 | 8 | 0,09 | 8,00 | 1 | 1 | 1 | 1 | 1 | 0 | 1 | 1 | 1 |
| HU | 10 | 0,41 | 49 | 0,53 | 4,90 | 7 | 8 | 8 | 3 | 6 | 1 | 10 | 3 | 3 |
| IE | 16 | 0,65 | 73 | 0,80 | 4,56 | 8 | 8 | 8 | 8 | 9 | 1 | 15 | 8 | 8 |
| IL | 18 | 0,73 | 77 | 0,84 | 4,28 | 9 | 8 | 10 | 7 | 11 | 2 | 17 | 6 | 7 |
| IN | 20 | 0,81 | 117 | 1,28 | 5,85 | 13 | 13 | 15 | 15 | 15 | 2 | 20 | 12 | 12 |
| IT | 92 | 3,74 | 393 | 4,28 | 4,27 | 38 | 48 | 46 | 33 | 55 | 6 | 92 | 33 | 42 |
| JO | 1 | 0,04 | 8 | 0,09 | 8,00 | 1 | 1 | 1 | 1 | 1 | 0 | 1 | 1 | 1 |
| JP | 88 | 3,58 | 272 | 2,96 | 3,09 | 18 | 25 | 20 | 26 | 45 | 6 | 88 | 18 | 26 |
| KR | 11 | 0,45 | 41 | 0,45 | 3,73 | 3 | 4 | 5 | 4 | 8 | 0 | 11 | 3 | 3 |
| KY | 2 | 0,08 | 16 | 0,17 | 8,00 | 2 | 2 | 2 | 2 | 2 | 0 | 2 | 2 | 2 |
| LI | 2 | 0,08 | 9 | 0,10 | 4,50 | 1 | 1 | 1 | 1 | 1 | 0 | 2 | 1 | 1 |
| LU | 15 | 0,61 | 61 | 0,66 | 4,07 | 5 | 6 | 7 | 6 | 12 | 0 | 15 | 5 | 5 |
| LV | 1 | 0,04 | 8 | 0,09 | 8,00 | 1 | 1 | 1 | 1 | 1 | 0 | 1 | 1 | 1 |
| MT | 2 | 0,08 | 12 | 0,13 | 6,00 | 1 | 2 | 1 | 1 | 2 | 1 | 2 | 1 | 1 |
| NL | 156 | 6,34 | 356 | 3,88 | 2,28 | 17 | 25 | 44 | 17 | 44 | 7 | 155 | 17 | 30 |
| NO | 41 | 1,67 | 179 | 1,95 | 4,37 | 15 | 24 | 20 | 14 | 28 | 5 | 41 | 14 | 18 |
| NZ | 5 | 0,20 | 17 | 0,19 | 3,40 | 1 | 1 | 2 | 1 | 5 | 0 | 5 | 1 | 1 |
| PH | 1 | 0,04 | 5 | 0,05 | 5,00 | 0 | 1 | 1 | 1 | 1 | 0 | 1 | 0 | 0 |
| PL | 10 | 0,41 | 44 | 0,48 | 4,40 | 5 | 5 | 6 | 4 | 7 | 0 | 9 | 4 | 4 |
| PT | 1 | 0,04 | 1 | 0,01 | 1,00 | 0 | 0 | 0 | 0 | 0 | 0 | 1 | 0 | 0 |
| RO | 1 | 0,04 | 3 | 0,03 | 3,00 | 0 | 0 | 1 | 0 | 1 | 0 | 1 | 0 | 0 |
| RS | 1 | 0,04 | 4 | 0,04 | 4,00 | 0 | 1 | 1 | 0 | 1 | 0 | 1 | 0 | 0 |
| SA | 13 | 0,53 | 31 | 0,34 | 2,38 | 2 | 3 | 2 | 3 | 3 | 0 | 13 | 3 | 2 |
| SE | 34 | 1,38 | 95 | 1,04 | 2,79 | 5 | 5 | 18 | 5 | 18 | 1 | 33 | 5 | 5 |
| SG | 4 | 0,16 | 6 | 0,07 | 1,50 | 0 | 0 | 0 | 0 | 2 | 0 | 4 | 0 | 0 |
| SI | 4 | 0,16 | 21 | 0,23 | 5,25 | 2 | 2 | 3 | 2 | 3 | 1 | 4 | 2 | 2 |
| SK | 1 | 0,04 | 5 | 0,05 | 5,00 | 1 | 1 | 1 | 0 | 1 | 0 | 1 | 0 | 0 |
| SN | 1 | 0,04 | 8 | 0,09 | 8,00 | 1 | 1 | 1 | 1 | 1 | 0 | 1 | 1 | 1 |
| TR | 13 | 0,53 | 74 | 0,81 | 5,69 | 8 | 11 | 8 | 8 | 9 | 2 | 12 | 8 | 8 |
| UA | 7 | 0,28 | 31 | 0,34 | 4,43 | 2 | 4 | 5 | 2 | 7 | 0 | 7 | 2 | 2 |
| US | 493 | 20,03 | 2 519 | 27,45 | 5,11 | 274 | 279 | 278 | 263 | 318 | 85 | 493 | 262 | 267 |
| UZ | 2 | 0,08 | 16 | 0,17 | 8,00 | 2 | 2 | 2 | 2 | 2 | 0 | 2 | 2 | 2 |
| ZA | 5 | 0,20 | 22 | 0,24 | 4,40 | 2 | 2 | 4 | 2 | 3 | 0 | 5 | 2 | 2 |
| Total | 2121 | 86,18 | 7902 | 86,12 | 3,73 | 700 | 783 | 958 | 669 | 1151 | 174 | 2111 | 649 | 707 |
| Grand Total | 2461 | 100,00 | 9176 | 100,00 | 3,73 | 810 | 912 | 1221 | 769 | 1361 | 180 | 2389 | 739 | 795 |
Table 4 shows 3.73 as the average number of designations of the EAPC Contracting States and the Republic of Moldova at the stage of the first payment of annual fees for maintaining the Eurasian patent in force.
The recurrence of designations of the EAPC Contracting States and the Republic of Moldova in relation to the total patents for which the annual maintenance fee was paid for the first time in 2018, is as follows: Russia, 97.07 per cent; Kazakhstan, 55.30 per cent; Belarus, 49.61 per cent; Azerbaijan, 37.06 per cent; Armenia, 32.91 per cent; Turkmenistan, 32.30 per cent; Kyrgyzstan, 31.25 per cent; Tajikistan, 30.03 per cent and Moldova, 7.31 per cent.
Subsequent annual fees were paid in 2018 for maintaining 10,558 Eurasian patents in force.
Table 5 summarises the details of Eurasian patents for which subsequent annual maintenance fees were paid in 2018.
Details of Eurasian patents for which subsequent maintenance fees were paid in 2018
| First patent owner’s country-of-origin code | Number of patents for which the annual maintenance fee was paid | Same in per cent of total number of patents | Number of designations of EAPC Contracting States and Republic of Moldova | Same in per cent of all designations | Average number of designations per patent | Designations of EAPC Contracting States and Republic of Moldova | ||||||||
|---|---|---|---|---|---|---|---|---|---|---|---|---|---|---|
| AM | AZ | BY | KG | KZ | MD | RU | TJ | TM | ||||||
| AM | 3 | 0,03 | 7 | 0,02 | 2,33 | 0 | 0 | 1 | 1 | 1 | 0 | 3 | 1 | 0 |
| AZ | 17 | 0,16 | 32 | 0,09 | 1,88 | 1 | 12 | 1 | 1 | 1 | 0 | 14 | 1 | 1 |
| BY | 202 | 1,91 | 565 | 1,55 | 2,80 | 22 | 32 | 187 | 20 | 82 | 7 | 190 | 13 | 12 |
| KG | 1 | 0,01 | 2 | 0,01 | 2,00 | 0 | 0 | 0 | 0 | 1 | 0 | 1 | 0 | 0 |
| KZ | 77 | 0,73 | 252 | 0,69 | 3,27 | 12 | 16 | 29 | 24 | 65 | 7 | 72 | 12 | 15 |
| MD | 6 | 0,06 | 27 | 0,07 | 4,50 | 2 | 3 | 5 | 2 | 5 | 0 | 6 | 2 | 2 |
| RU | 783 | 7,42 | 2 992 | 8,23 | 3,82 | 251 | 324 | 549 | 196 | 546 | 92 | 662 | 194 | 178 |
| TJ | 3 | 0,03 | 12 | 0,03 | 4,00 | 1 | 1 | 1 | 1 | 1 | 1 | 3 | 2 | 1 |
| TM | 2 | 0,02 | 2 | 0,01 | 1,00 | 0 | 0 | 0 | 0 | 0 | 0 | 2 | 0 | 0 |
| Total | 1094 | 10,36 | 3891 | 10,71 | 3,56 | 289 | 388 | 773 | 245 | 702 | 107 | 953 | 225 | 209 |
| AE | 11 | 0,10 | 58 | 0,16 | 5,27 | 4 | 7 | 8 | 4 | 10 | 4 | 10 | 5 | 6 |
| AN | 2 | 0,02 | 10 | 0,03 | 5,00 | 1 | 1 | 1 | 1 | 1 | 1 | 2 | 1 | 1 |
| AR | 3 | 0,03 | 20 | 0,06 | 6,67 | 3 | 3 | 3 | 2 | 2 | 0 | 3 | 2 | 2 |
| AT | 179 | 1,70 | 559 | 1,54 | 3,12 | 31 | 52 | 88 | 33 | 95 | 26 | 174 | 31 | 29 |
| AU | 109 | 1,03 | 417 | 1,15 | 3,83 | 28 | 27 | 50 | 31 | 81 | 21 | 106 | 45 | 28 |
| BB | 1 | 0,01 | 9 | 0,02 | 9,00 | 1 | 1 | 1 | 1 | 1 | 1 | 1 | 1 | 1 |
| BE | 401 | 3,80 | 1 407 | 3,87 | 3,51 | 114 | 125 | 163 | 107 | 172 | 109 | 398 | 106 | 113 |
| BG | 6 | 0,06 | 37 | 0,10 | 6,17 | 4 | 4 | 4 | 4 | 4 | 3 | 6 | 4 | 4 |
| BH | 1 | 0,01 | 2 | 0,01 | 2,00 | 1 | 0 | 0 | 0 | 0 | 0 | 1 | 0 | 0 |
| BM | 8 | 0,08 | 55 | 0,15 | 6,88 | 7 | 6 | 6 | 6 | 7 | 6 | 8 | 3 | 6 |
| BR | 8 | 0,08 | 8 | 0,02 | 1,00 | 0 | 0 | 0 | 0 | 0 | 0 | 8 | 0 | 0 |
| BS | 2 | 0,02 | 6 | 0,02 | 3,00 | 0 | 1 | 1 | 0 | 1 | 0 | 2 | 0 | 1 |
| CA | 101 | 0,96 | 406 | 1,12 | 4,02 | 35 | 40 | 45 | 33 | 68 | 24 | 95 | 33 | 33 |
| CH | 648 | 6,14 | 2 047 | 5,63 | 3,16 | 141 | 143 | 243 | 156 | 312 | 134 | 640 | 134 | 144 |
| CL | 8 | 0,08 | 19 | 0,05 | 2,38 | 2 | 2 | 0 | 0 | 5 | 2 | 8 | 0 | 0 |
| CN | 151 | 1,43 | 603 | 1,66 | 3,99 | 41 | 53 | 84 | 52 | 97 | 31 | 150 | 42 | 53 |
| CU | 10 | 0,09 | 14 | 0,04 | 1,40 | 0 | 0 | 1 | 1 | 1 | 0 | 10 | 1 | 0 |
| CY | 22 | 0,21 | 133 | 0,37 | 6,05 | 16 | 18 | 18 | 10 | 19 | 8 | 22 | 10 | 12 |
| CZ | 52 | 0,49 | 143 | 0,39 | 2,75 | 10 | 10 | 23 | 6 | 29 | 3 | 52 | 4 | 6 |
| DE | 1 286 | 12,18 | 3 301 | 9,08 | 2,57 | 154 | 192 | 578 | 145 | 493 | 159 | 1272 | 146 | 162 |
| DK | 277 | 2,62 | 747 | 2,06 | 2,70 | 45 | 60 | 107 | 43 | 77 | 42 | 275 | 44 | 54 |
| EE | 14 | 0,13 | 29 | 0,08 | 2,07 | 0 | 1 | 9 | 0 | 5 | 0 | 14 | 0 | 0 |
| EG | 1 | 0,01 | 1 | 0,00 | 1,00 | 0 | 0 | 0 | 0 | 0 | 0 | 1 | 0 | 0 |
| ES | 61 | 0,58 | 226 | 0,62 | 3,70 | 18 | 21 | 28 | 17 | 30 | 17 | 60 | 17 | 18 |
| FI | 429 | 4,06 | 790 | 2,17 | 1,84 | 13 | 30 | 72 | 16 | 192 | 11 | 425 | 15 | 16 |
| FR | 668 | 6,33 | 2 095 | 5,77 | 3,14 | 167 | 207 | 207 | 142 | 260 | 139 | 661 | 142 | 170 |
| GB | 430 | 4,07 | 1 573 | 4,33 | 3,66 | 123 | 176 | 170 | 114 | 228 | 94 | 423 | 117 | 128 |
| GR | 7 | 0,07 | 19 | 0,05 | 2,71 | 2 | 2 | 2 | 1 | 2 | 1 | 7 | 1 | 1 |
| HK | 4 | 0,04 | 20 | 0,06 | 5,00 | 2 | 2 | 2 | 2 | 2 | 2 | 4 | 2 | 2 |
| HR | 6 | 0,06 | 20 | 0,06 | 3,33 | 2 | 3 | 3 | 1 | 3 | 0 | 6 | 1 | 1 |
| HU | 70 | 0,66 | 448 | 1,23 | 6,40 | 46 | 51 | 52 | 45 | 52 | 44 | 70 | 44 | 44 |
| IE | 82 | 0,78 | 351 | 0,97 | 4,28 | 31 | 31 | 38 | 30 | 54 | 24 | 82 | 30 | 31 |
| IL | 61 | 0,58 | 270 | 0,74 | 4,43 | 26 | 32 | 34 | 25 | 35 | 20 | 58 | 20 | 20 |
| IN | 81 | 0,77 | 481 | 1,32 | 5,94 | 47 | 51 | 52 | 51 | 59 | 44 | 80 | 49 | 48 |
| IS | 5 | 0,05 | 8 | 0,02 | 1,60 | 0 | 0 | 2 | 0 | 1 | 0 | 5 | 0 | 0 |
| IT | 385 | 3,65 | 1 814 | 4,99 | 4,71 | 148 | 188 | 233 | 146 | 255 | 150 | 380 | 142 | 172 |
| JP | 448 | 4,24 | 1 160 | 3,19 | 2,59 | 63 | 105 | 89 | 66 | 178 | 56 | 444 | 62 | 97 |
| KN | 1 | 0,01 | 1 | 0,00 | 1,00 | 0 | 0 | 0 | 0 | 0 | 0 | 1 | 0 | 0 |
| KR | 48 | 0,45 | 205 | 0,56 | 4,27 | 17 | 20 | 22 | 21 | 34 | 13 | 47 | 15 | 16 |
| KW | 1 | 0,01 | 9 | 0,02 | 9,00 | 1 | 1 | 1 | 1 | 1 | 1 | 1 | 1 | 1 |
| KY | 4 | 0,04 | 12 | 0,03 | 3,00 | 1 | 1 | 1 | 1 | 1 | 1 | 4 | 1 | 1 |
| LI | 4 | 0,04 | 14 | 0,04 | 3,50 | 1 | 1 | 3 | 1 | 1 | 1 | 4 | 1 | 1 |
| LT | 2 | 0,02 | 4 | 0,01 | 2,00 | 0 | 0 | 1 | 0 | 1 | 0 | 2 | 0 | 0 |
| LU | 76 | 0,72 | 383 | 1,05 | 5,04 | 37 | 35 | 40 | 34 | 60 | 33 | 76 | 33 | 35 |
| LV | 23 | 0,22 | 148 | 0,41 | 6,43 | 15 | 17 | 20 | 14 | 19 | 12 | 23 | 14 | 14 |
| MA | 4 | 0,04 | 12 | 0,03 | 3,00 | 1 | 1 | 1 | 1 | 1 | 1 | 4 | 1 | 1 |
| MC | 1 | 0,01 | 1 | 0,00 | 1,00 | 0 | 0 | 0 | 0 | 0 | 0 | 1 | 0 | 0 |
| MT | 2 | 0,02 | 9 | 0,02 | 4,50 | 1 | 1 | 1 | 1 | 1 | 0 | 2 | 1 | 1 |
| MU | 1 | 0,01 | 9 | 0,02 | 9,00 | 1 | 1 | 1 | 1 | 1 | 1 | 1 | 1 | 1 |
| MX | 9 | 0,09 | 54 | 0,15 | 6,00 | 5 | 6 | 5 | 5 | 9 | 5 | 9 | 5 | 5 |
| MY | 4 | 0,04 | 6 | 0,02 | 1,50 | 0 | 0 | 0 | 0 | 1 | 0 | 4 | 1 | 0 |
| NL | 670 | 6,35 | 1 484 | 4,08 | 2,21 | 53 | 136 | 180 | 47 | 214 | 39 | 659 | 47 | 109 |
| NO | 237 | 2,24 | 830 | 2,28 | 3,50 | 50 | 145 | 57 | 45 | 152 | 39 | 235 | 50 | 57 |
| NZ | 21 | 0,20 | 66 | 0,18 | 3,14 | 4 | 6 | 4 | 4 | 16 | 1 | 21 | 4 | 6 |
| PE | 1 | 0,01 | 9 | 0,02 | 9,00 | 1 | 1 | 1 | 1 | 1 | 1 | 1 | 1 | 1 |
| PL | 29 | 0,27 | 166 | 0,46 | 5,72 | 17 | 19 | 25 | 14 | 23 | 11 | 26 | 16 | 15 |
| PR | 1 | 0,01 | 9 | 0,02 | 9,00 | 1 | 1 | 1 | 1 | 1 | 1 | 1 | 1 | 1 |
| PT | 4 | 0,04 | 12 | 0,03 | 3,00 | 1 | 1 | 1 | 1 | 1 | 1 | 4 | 1 | 1 |
| RO | 3 | 0,03 | 8 | 0,02 | 2,67 | 1 | 0 | 1 | 0 | 2 | 0 | 3 | 0 | 1 |
| RS | 6 | 0,06 | 9 | 0,02 | 1,50 | 0 | 1 | 1 | 1 | 0 | 0 | 6 | 0 | 0 |
| SA | 37 | 0,35 | 73 | 0,20 | 1,97 | 0 | 9 | 0 | 9 | 10 | 0 | 36 | 9 | 0 |
| SC | 1 | 0,01 | 2 | 0,01 | 2,00 | 0 | 0 | 0 | 0 | 1 | 0 | 1 | 0 | 0 |
| SE | 166 | 1,57 | 491 | 1,35 | 2,96 | 32 | 35 | 78 | 28 | 71 | 26 | 162 | 29 | 30 |
| SG | 13 | 0,12 | 54 | 0,15 | 4,15 | 5 | 5 | 7 | 5 | 5 | 4 | 13 | 5 | 5 |
| SI | 41 | 0,39 | 91 | 0,25 | 2,22 | 6 | 5 | 10 | 3 | 14 | 4 | 41 | 4 | 4 |
| SK | 3 | 0,03 | 21 | 0,06 | 7,00 | 2 | 3 | 3 | 2 | 3 | 1 | 3 | 2 | 2 |
| TH | 1 | 0,01 | 3 | 0,01 | 3,00 | 0 | 1 | 0 | 0 | 1 | 0 | 1 | 0 | 0 |
| TR | 48 | 0,45 | 222 | 0,61 | 4,63 | 21 | 26 | 22 | 21 | 24 | 17 | 48 | 21 | 22 |
| TW | 13 | 0,12 | 101 | 0,28 | 7,77 | 11 | 11 | 11 | 11 | 11 | 11 | 13 | 11 | 11 |
| UA | 35 | 0,33 | 154 | 0,42 | 4,40 | 14 | 15 | 30 | 10 | 28 | 10 | 29 | 9 | 9 |
| US | 1 876 | 17,77 | 8 323 | 22,90 | 4,44 | 773 | 889 | 884 | 728 | 1054 | 655 | 1831 | 731 | 778 |
| UZ | 2 | 0,02 | 2 | 0,01 | 1,00 | 0 | 0 | 0 | 0 | 1 | 0 | 1 | 0 | 0 |
| VG | 14 | 0,13 | 67 | 0,18 | 4,79 | 5 | 8 | 7 | 5 | 10 | 5 | 14 | 5 | 8 |
| YU | 3 | 0,03 | 4 | 0,01 | 1,33 | 0 | 0 | 1 | 0 | 0 | 1 | 2 | 0 | 0 |
| ZA | 21 | 0,20 | 73 | 0,20 | 3,48 | 6 | 6 | 6 | 6 | 12 | 5 | 21 | 6 | 5 |
| Total | 9464 | 89,64 | 32447 | 89,29 | 3,43 | 2409 | 3052 | 3843 | 2313 | 4616 | 2076 | 9314 | 2280 | 2544 |
| Grand Total | 10558 | 100,00 | 36338 | 100,00 | 3,44 | 2698 | 3440 | 4616 | 2558 | 5318 | 2183 | 10267 | 2505 | 2753 |
Table 5 shows 3.44 as the average number of designations of the EAPC Contracting States and the Republic of Moldova for the payment of subsequent annual fees for maintaining the Eurasian patents in force. The recurrence of designations of the EAPC Contracting States and the Republic of Moldova in relation to the total patents for which the annual maintenance fee was paid in 2018 was as follows: Russia, 97.24 per cent; Kazakhstan, 50.37 per cent; Belarus, 43.72 per cent; Azerbaijan, 32.58 per cent; Turkmenistan, 26.08 per cent; Armenia, 25.55 per cent; Kyrgyzstan, 24.23 per cent; Tajikistan, 23.73 per cent and Moldova, 20.68 per cent.
| Russia – 97,24% | Azerbaijan – 32,58% | Kyrgyzstan – 24,23% |
| Kazakhstan – 50,37% | Turkmenistan – 26,08% | Tajikistan – 23,73% |
| Belarus – 43,72% | Armenia – 25,55% | Moldova – 20,68% |
The year 2018 saw 120 Eurasian patents restored after termination for non-payment in due time of the annual fee for keeping the patents in force.
In conformity with national laws of the EAPC Contracting States and the Republic of Moldova which provide for additional legal protection for products requiring special permission for application, the validity of 36 Eurasian patents was extended during the period under review, at the request by relevant patent holders, in the territory of the Republic of Armenia (3 patents), the Republic of Azerbaijan (1 patent), the Republic of Belarus (3 patents), the Republic of Kazakhstan (14 patents), the Russian Federation (13 patents) and the Republic of Moldova (2 patents).
In 2018 the national patent offices of the Republic of Belarus, the Republic of Kazakhstan, the Russian Federation and the Republic of Moldova contributed information to the Eurasian Patent Office on the registered licence contracts based on Eurasian patents. Relevant information about 46 registered licence contracts based on 53 Eurasian patents was published in the EAPO Gazette.